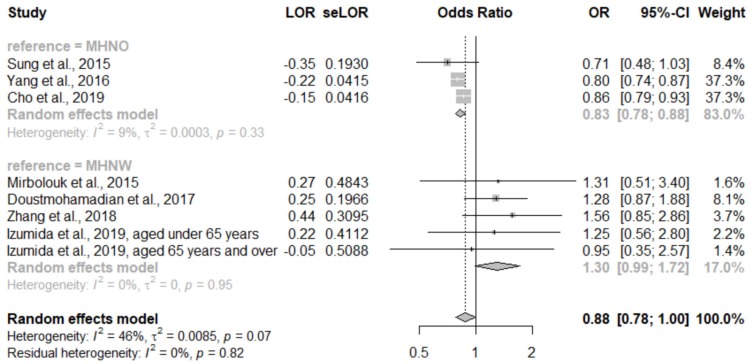
Figure 5.
Forest plot of all-cause mortality comparing participants with metabolically healthy obesity and participants with metabolically healthy non-obesity (subgroup analysis according to comparison group). CI: Confidence interval; LOR: Logarithms of the odds ratio; MHNO: Metabolically healthy obesity; MHNW: Metabolically healthy normal weight; OR: Odds ratio; se: Standard error.

