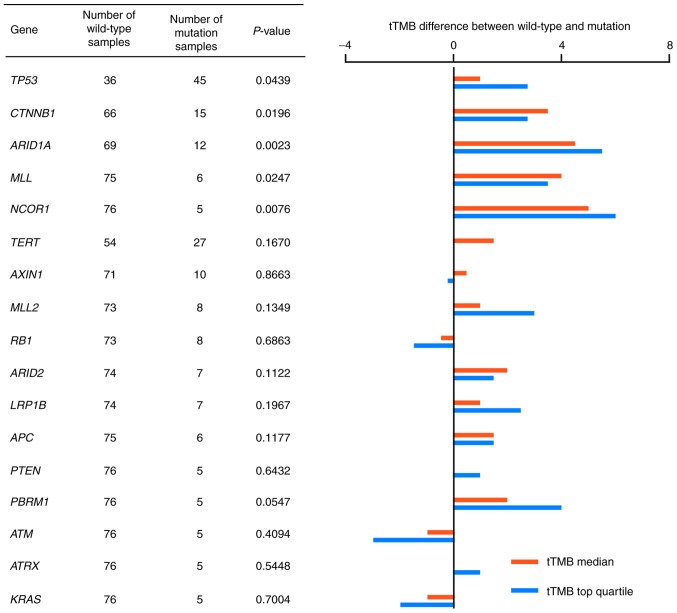
Figure 3.
Association between gene mutation and median tTMB and top quartile tTMB values. Ratio of median tTMB values and the ratio of top quartile values of tTMB in mutated and wild-type samples are indicated by red and blue lines, respectively. A total of 18 genes were mutated in at least 5 samples. tTMB, tissue tumor mutation burden.

