Figure 1.
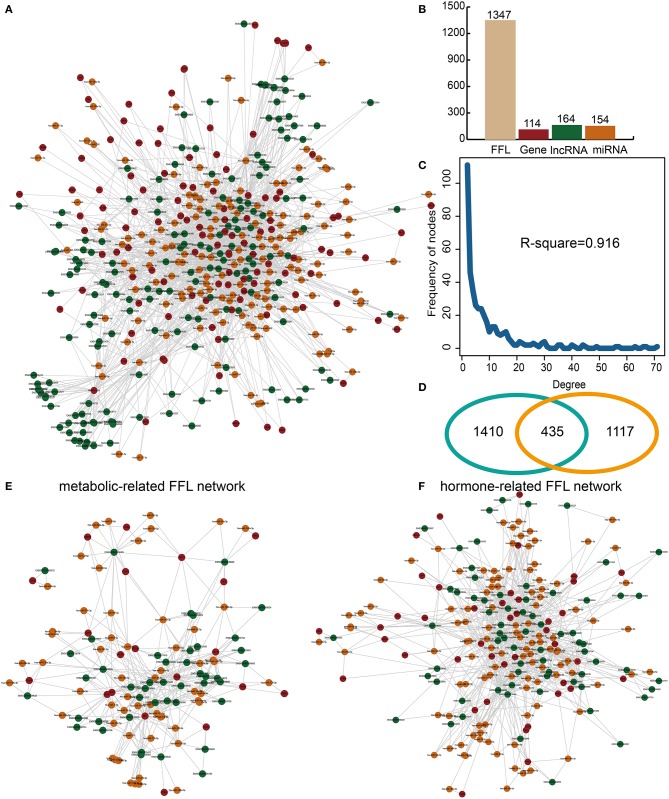
Construction and analysis of glycometabolism- and hormone-related lnc-FFL networks. (A) A global lnc-FFL network based on experimentally verified interaction data. lncRNAs, miRNAs, and genes are colored in green, yellow, and red, respectively. (B) Bar plot, showing the number of lncRNAs, miRNAs, and genes in the global lnc-FFLs network. (C) The degree distribution of the global lnc-FFL network. (D) Venn diagram, showing the intersection between glycometabolism- and hormone-related genes. (E) The glycometabolism-related lnc-FFL network. (F) The hormone-related lnc-FFL network.

