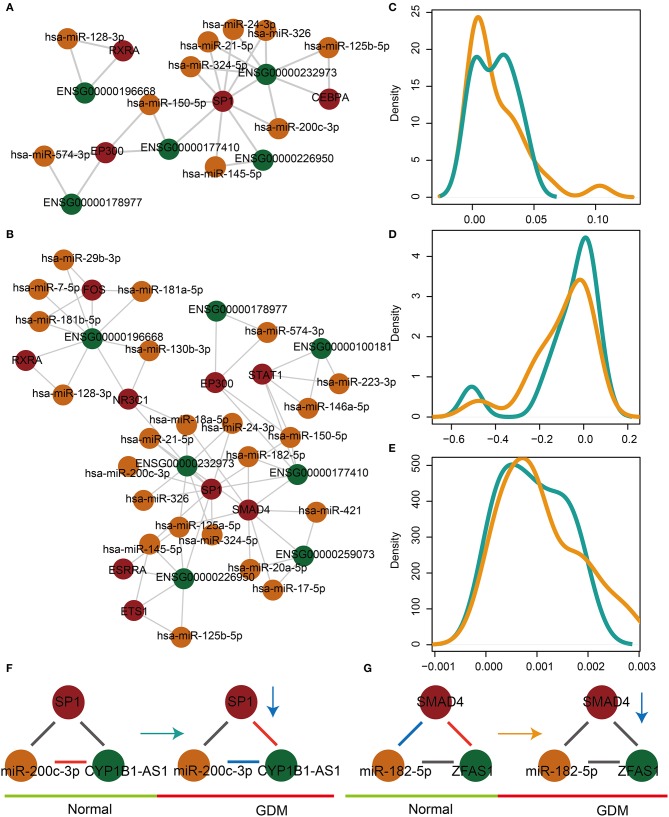
Figure 2.
The dysregulated glycometabolism- and hormone-related lnc-FFL networks. (A) The dysregulated glycometabolism-related lnc-FFL network. (B) The dysregulated hormone-related lnc-FFL network. (C–E) Density distribution curves of CSdif, CSPCC, and final score, respectively, in dysregulated glycometabolism- and hormone-related lnc-FFL networks. (F,G) Two examples showing dysregulated patterns of lnc-FFLs in GDM.

