Figure 1.

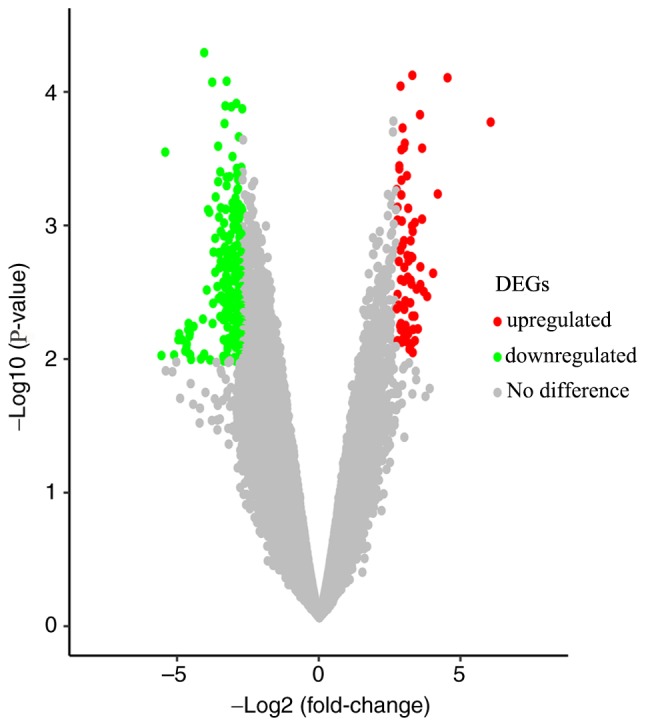
Volcano map of the DEGs in pancreatic ductal adenocarcinoma. Red dots represent upregulated genes, green dots represent downregulated genes and gray dots represent genes that are unchanged. DEGs, differentially expressed genes.

Volcano map of the DEGs in pancreatic ductal adenocarcinoma. Red dots represent upregulated genes, green dots represent downregulated genes and gray dots represent genes that are unchanged. DEGs, differentially expressed genes.