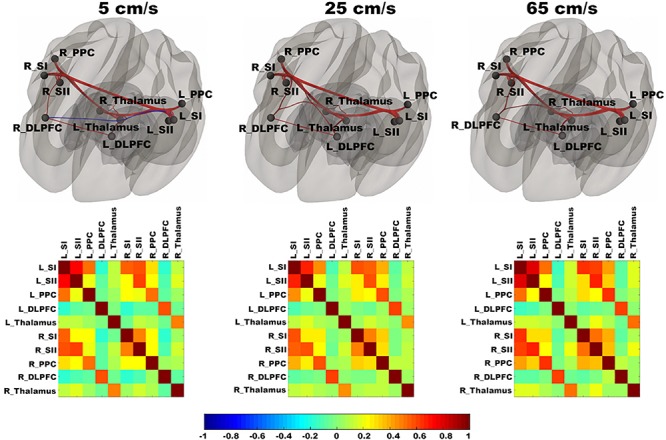
FIGURE 3.

Shows ROI-to-ROI based connectivity maps (first row) and connectivity adjacent matrices (second row) for three velocities (5, 25, 65 cm/s). Total six region of interests (ROIs) include bilateral primary somatosensory cortex (L_SI and R_SI), bilateral supplementary somatosensory cortex (L_SII and R_SII), bilateral Posterior Parietal Cortex (L_PPC and R_PPC), bilateral dorsolateral Prefrontal Cortex (L_DLPFC and R_DLPFC), and bilateral thalamus (L_Thalamus and R_Thalamus). The color bar ranges from –1 to 1 and indicates the connectivity strength measured by Pearson’s correlation coefficients. On the connectivity maps, the ROIs are in block dots and positive connections are in red and negative connections are in blue. The thickness of the line is determined by the connectivity strength.
