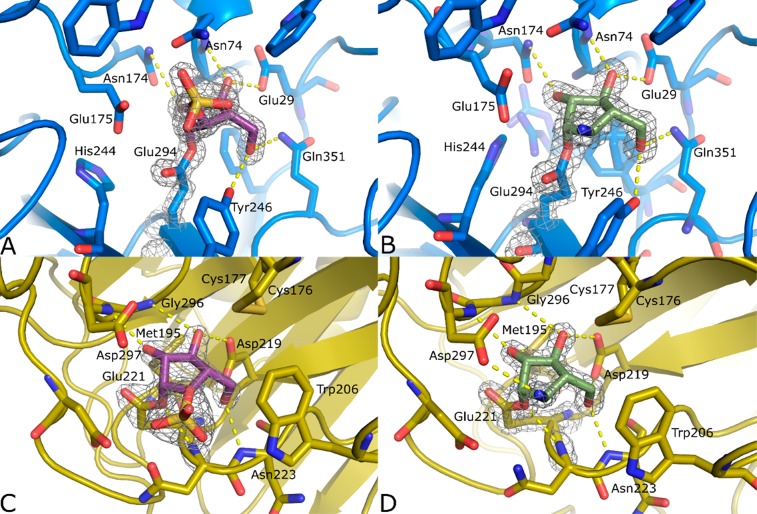
Figure 3.
Crystal structures of complexes between inhibitors 2 (B, D, green) and 6 (A, C, purple), and GsGH51 (A, B, blue) and AkAbfB (C, D, yellow). 2F0 – Fc electron density is shown for both the ligand and the catalytic nucleophile as a gray mesh contoured at 2σ. The polypeptide is shown in cartoon form with active site residues shown as sticks. Apparent hydrogen bonding interactions are shown as dotted yellow lines.

