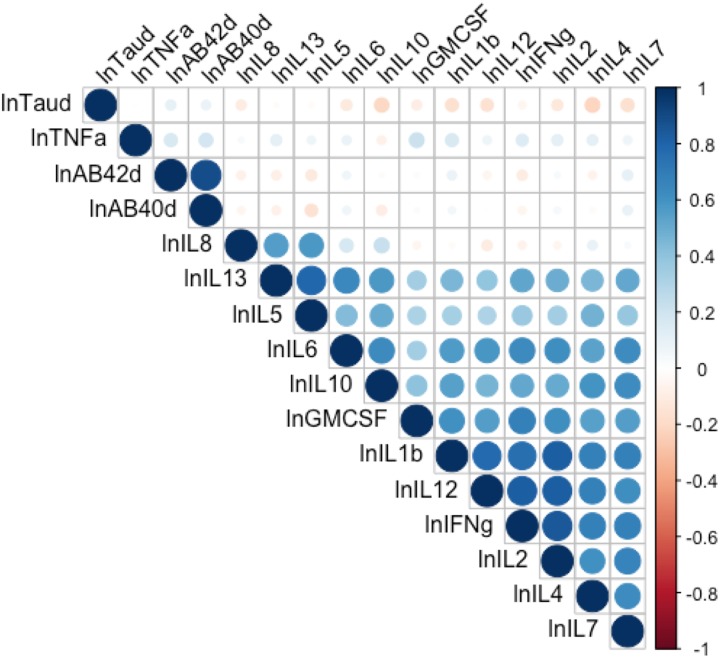
Figure 1.
Pearson’s correlation matrix of log-transformed concentrations of cytokines, amyloid beta 42 and 40, and tau. Circle size illustrates strength of the bivariate correlation. Blue illustrates positive and red illustrates negative correlations. The d at the end of lnTaud, lnAβ42d, and lnAβ40d indicates dilution corrected. AB = amyloid beta; GMCSF = granulocyte-macrophage colony-stimulating factor; IFNg = interferon gamma; IL = interleukin; ln = natural log; TNFa = tumor necrosis factor-alpha.

