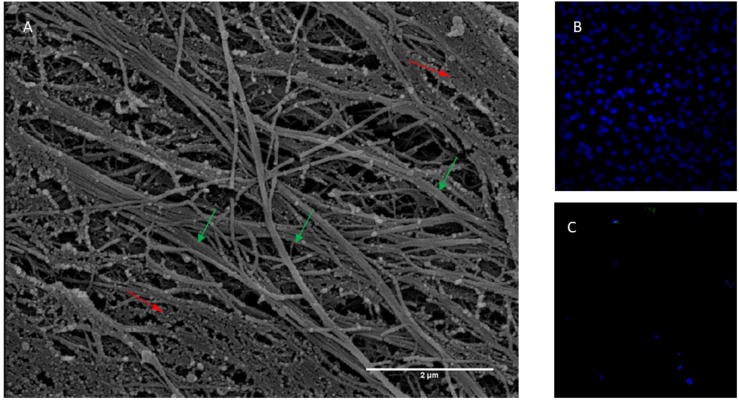
FIGURE 1.
(A) Scanning electron micrograph of ECM obtained from bone marrow stem cells. Banded fibres are indicated with green arrows while body cellular residues with red arrows. Thickness of fibres 100 nm about. Magnification 20,000×. Scale Bar 2 μm. (B) Not decellularized and (C) decellularized extracellular matrix stained with DAPI.

