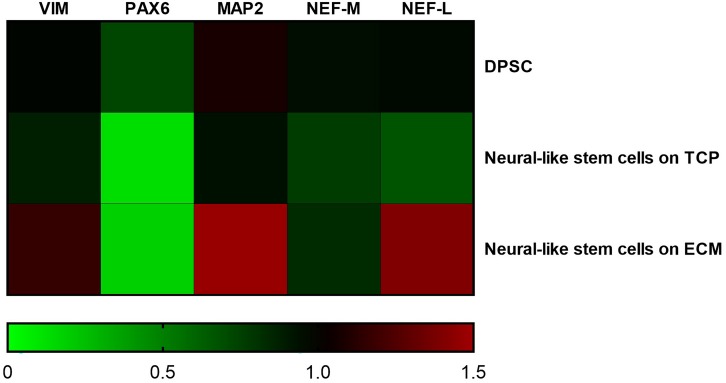
FIGURE 8.
Gene expression change during differentiation. Densitometric results of semi-quantitative RT-PCR analysis demonstrate a significant increase in early (PAX6 and VIM) and mature (MAP2, NF-L, and NF-M) neuronal markers. mRNA levels were normalized to the amount of β-actin mRNA and represented in a heatmap. The data are expressed as mean ± standard deviation (***P < 0.001 vs. Control as determined by two-way ANOVA followed by Tukey–Kramer post hoc test) from at least three independent experiments.

