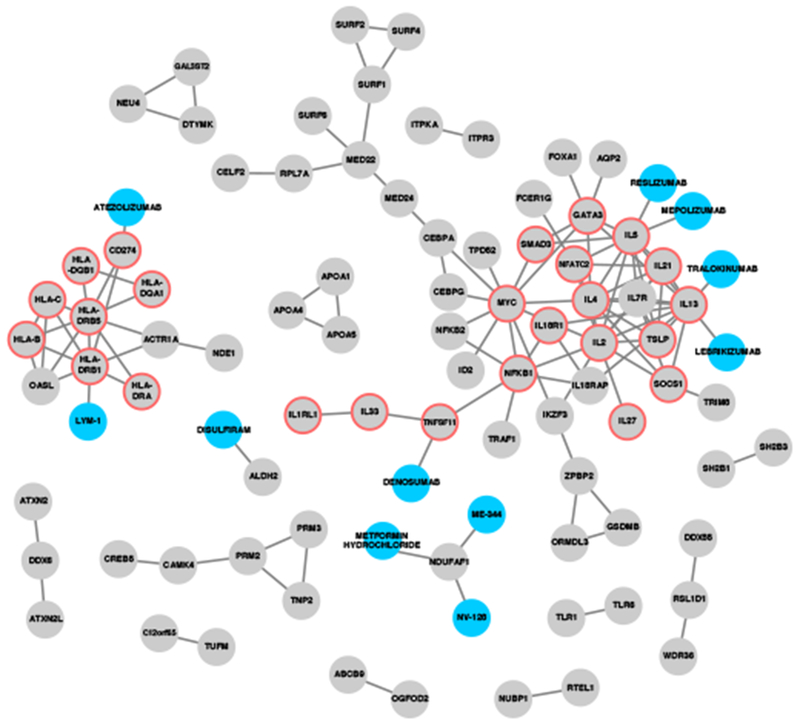
Figure 4: Interaction network between drugs and proteins from genes associated with allergic rhinitis.

Grey nodes represent locus genes as well as genes prioritized from e/meQTL and PCHiC sources, based on genetics association of 16,531,985 markers with allergic rhinitis in 212,120 individuals. Blue nodes represent drugs from the ChEMBL drug database. Edges represent very-high confidence interactions from the STRING database (for locus-locus interactions) and drug target evidence (for drug-locus interactions). Red borders indicate genes with protein products that were significantly enriched in the “Th1 and Th2 Activation” pathway (-log[p-value] >19.1) from the IPA pathway analysis.
