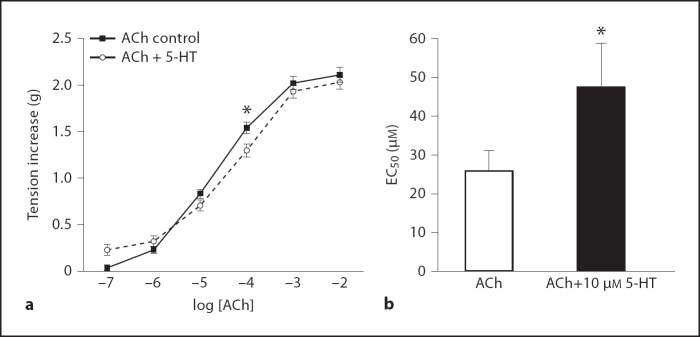
Fig. 3.
a ACh concentration-response curves with and without preincubation with 10 µM 5-HT, all groups combined. * Tension increase induced by 0.1 µM ACh is significantly less in the tissue preincubated with 10 µM 5-HT. b EC50 values derived from ACh concentration-response curves. * EC50 for tissue preincubated with 10 µM 5-HT is significantly greater. Values are means ± SE, n = 6 (p < 0.05).

