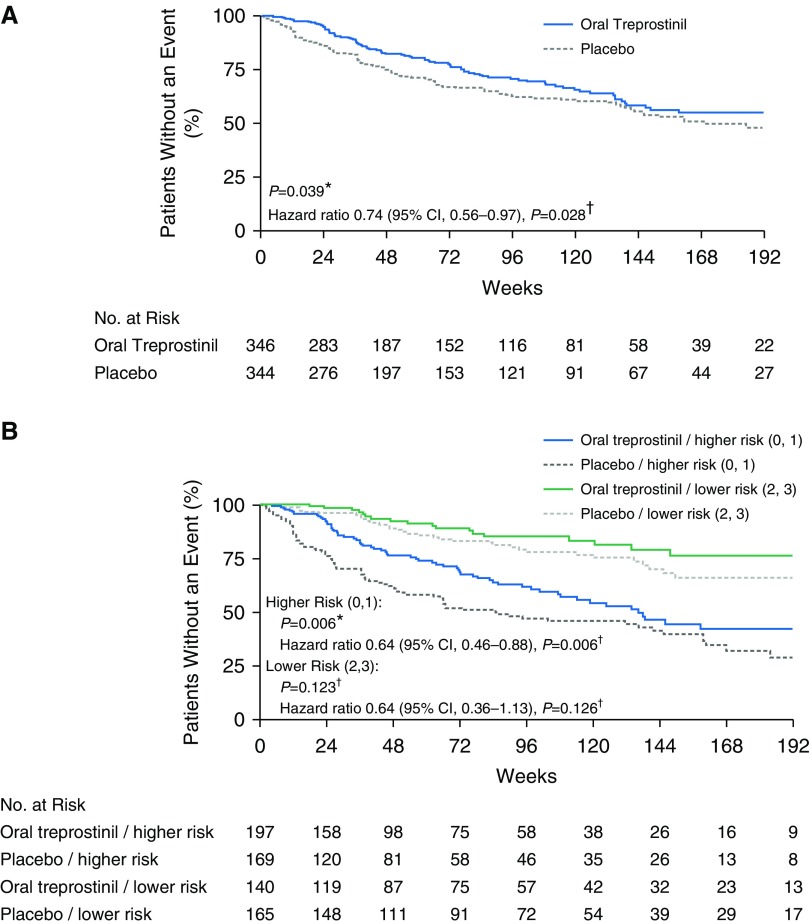
Figure 2.
Kaplan-Meier plots of primary endpoint and primary endpoint by baseline risk stratification. (A) Time to adjudicated clinical worsening events. (B) Time to adjudicated clinical worsening events by baseline risk stratification. “Lower risk” is defined as subjects with two or three low-risk criteria met; “higher risk” is defined as subjects with zero or one low-risk criterion met. *P values were calculated with log-rank test stratified by background pulmonary arterial hypertension (PAH) therapy and baseline 6-minute-walk distance (6MWD) category. †Hazard ratios, 95% confidence intervals (CIs), and P values were calculated with proportional hazard model with explanatory variables of treatment, background PAH therapy, and baseline 6MWD as a continuous variable.

