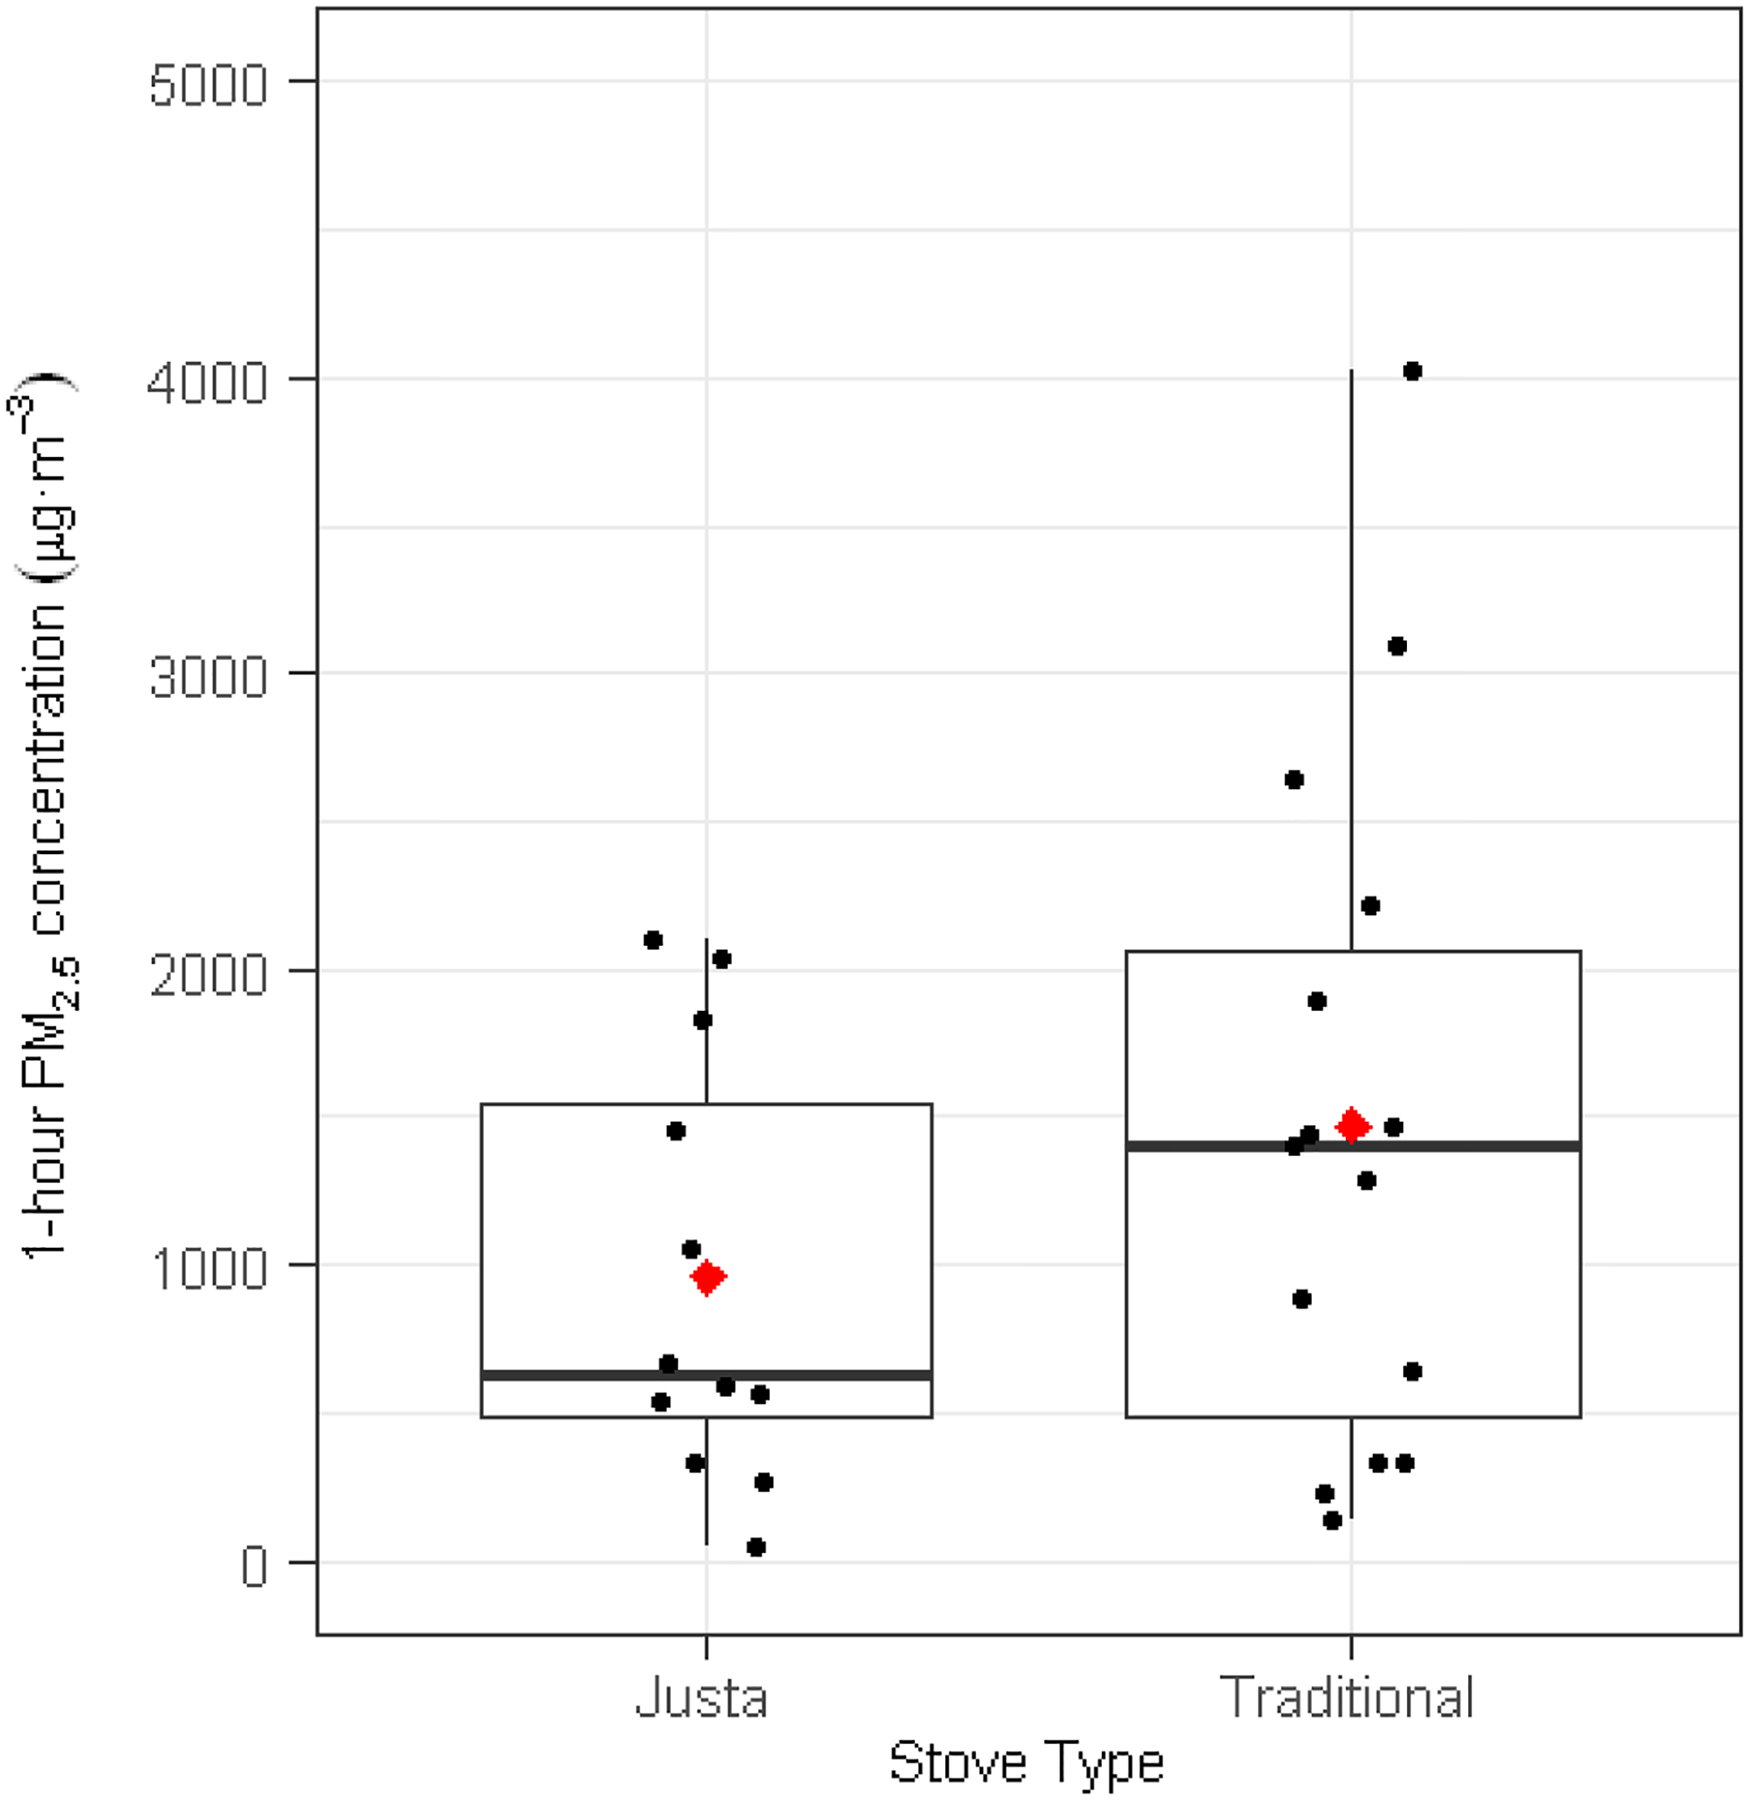
Figure 3:

Maximum 1-hour average PM2.5 concentrations measured in kitchens using traditional and cleaner-burning Justa stoves (N = 27) in rural Honduras. Black dots represent the observed concentrations. The lower boundary of the box represents the 25th percentile; the line within the box is the median; the upper boundary represents the 75th percentile. Bars indicate the 10th and 90th percentiles and the “◊” represents the mean.
