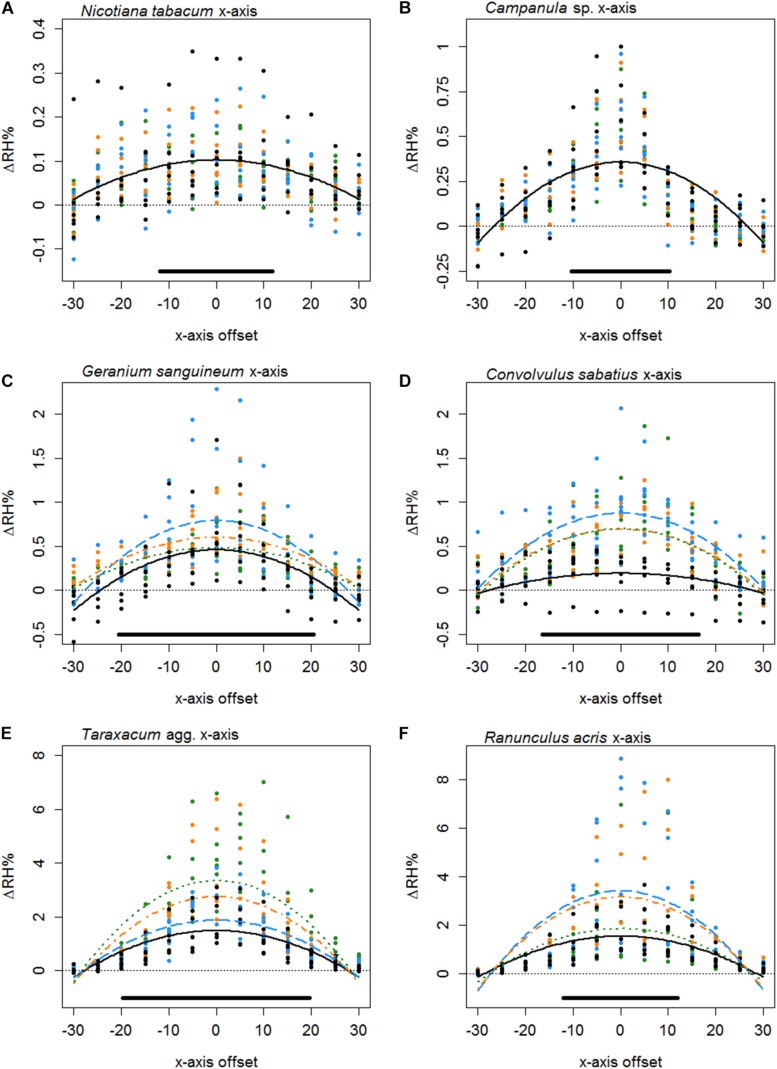
FIGURE 4.
The difference in humidity relative to the backgrounds (ΔRH) or the x axis transects of Nicotiana tabacum (A), Campanula sp. (B), Geranium sanguineum (C), Convolvulus sabatius (D), Taraxacum agg. (E), and Ranunculus acris (F). Plots for other species surveyed and controls are given in Supplementary File 3. All axis offsets are relative to the transect central point and in millimeters. The thin dotted line indicates a 0% change in humidity (the background level). Bold lines indicate the mean change in humidity as predicted by the best-fitting model for that flower. Color and dashing of bold lines and points indicate the replicate transect: solid black, first transect; long-dash blue, second transect; dash-dot orange, third transect; dotted green, fourth transect. The solid bar above the x axis indicates the mean flower span for that species relative to the x axis.

