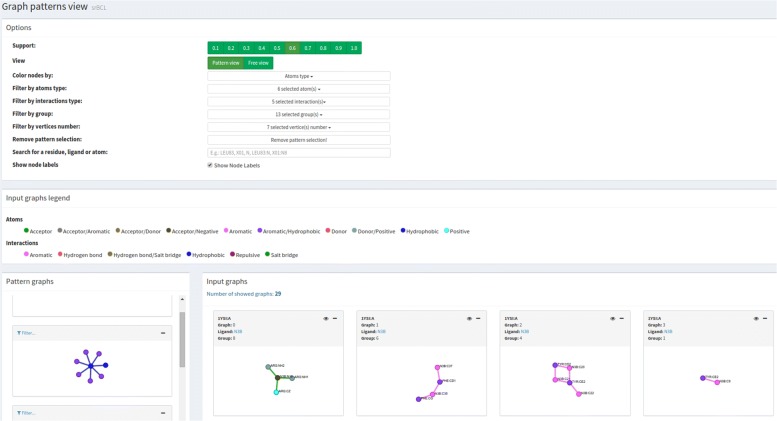
Fig. 4.
Motif view. This module has 4 main panels: Options provides a set of filters to explore PLI motifs; Graphs legend displays the colors used to depict atoms and edges; Motif graphs shows the set of PLI motifs according to selected filters; and Input PLI graphs depicts the PLI graphs that represent the interface between a ligand and a protein

