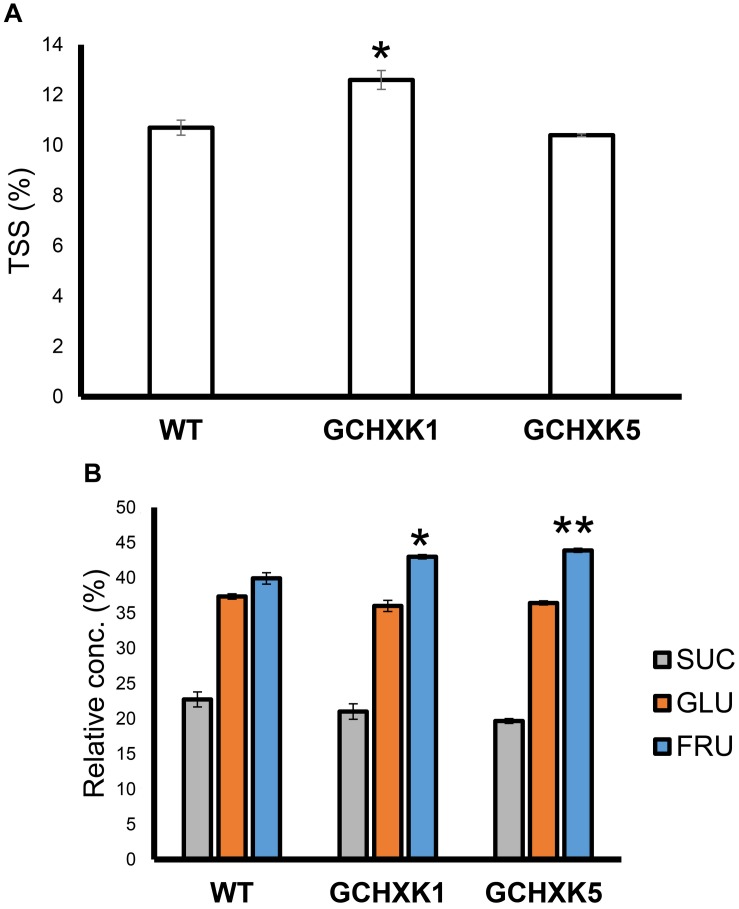
FIGURE 10.
TSS content and sugar content of GCHXK fruit. (A) TSS levels in the juices of GCHXK lines, compared to the WT. (B) Relative sucrose, fructose, and glucose levels (from total sugar content) in the juice of GCHXK lines, compared to the WT. Each measurement included three samples. For the WT and GCHXK1, the juice of each sample was collected from two different fruits. For GCHXK5, the juice of each sample was collected from one fruit (due to a lack of fruits). Data are displayed as means ± SE. Asterisks denote significant differences relative to the WT (t-test, *P < 0.05; **P < 0.01).

