Fig. 8.
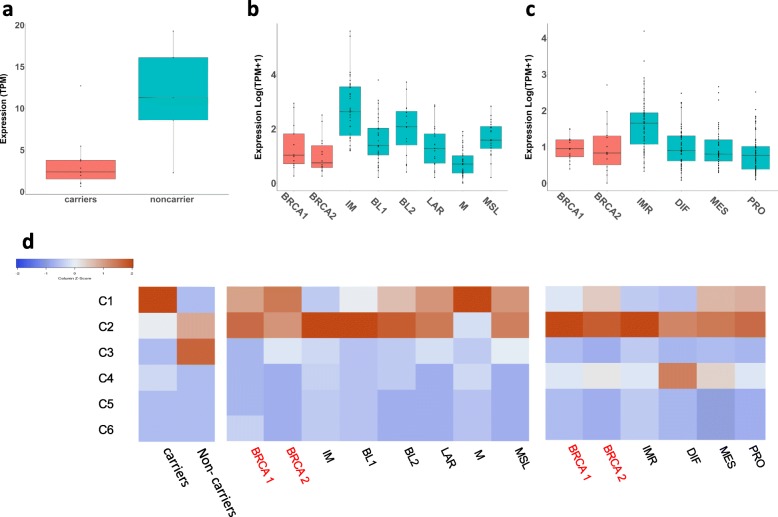
The immune response pattern in hereditary and sporadic breast and ovarian cancers from the clinical trial and from TCGA database. Expression of PD-L1 (CD274) in carriers and non-carriers from our cohort (a) in breast tumors from TCGA (b) and in HGSOC from TCGA (c). Heat-map showing relative contribution (percentage) of six universal intratumor immune states (C1-C6) within microenvironments of tumors from our cohort and from hereditary and sporadic breast and ovarian cancers form TCGA (d). PD-L1 for TCGA samples was downloaded from The Cancer Immunome Atlas (TCIA) (https://tcia.at/home). Immune Subtyping on the clinical trial samples was performed using the Immune Subtype Classifier available from The Cancer Research Institutes iAtlas (https://www.cri-iatlas.org/about/) and is also shown in Fig. 4a. Immune Subtypes for TCGA data were download from iAtlas

