Fig. 9.
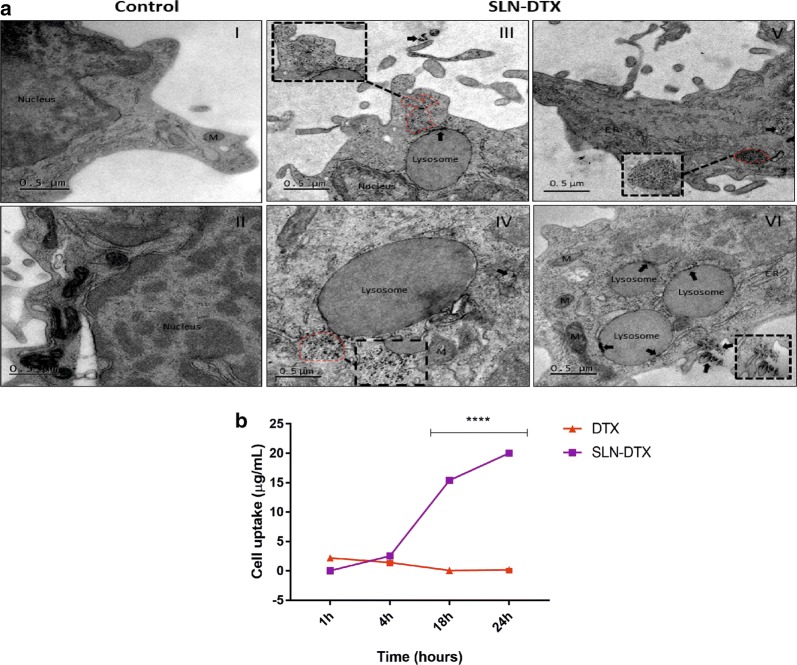
a Ultrastructural images of 4T1 cells. (I–II) Control cells (untreated). (III–VI) Cells treated with 10 µg/mL of SLN-DTX for 24 h. (III–V) SLN-DTX internalized (dashed line); (V) cluster of SLN-DTX in cytoplasm (dashed line); (VI) internalization of SLN-DTX into lysosomes (arrows). Dashed lines, arrows (into lysosomes) and arrow heads indicate nanoparticles. ER Endoplasmic reticulum, M Mitochondria. Magnification: 5 K; 15 K (black dashed lines). b In vitro cellular uptake studies of DTX in 4T1 cells. Cells were exposed to SLN-DTX or DTX for 1 h, 4 h, 18 h and 24 h at 100 µg/mL. Data are expressed as mean ± standard error of the mean (****p < 0.0001)

