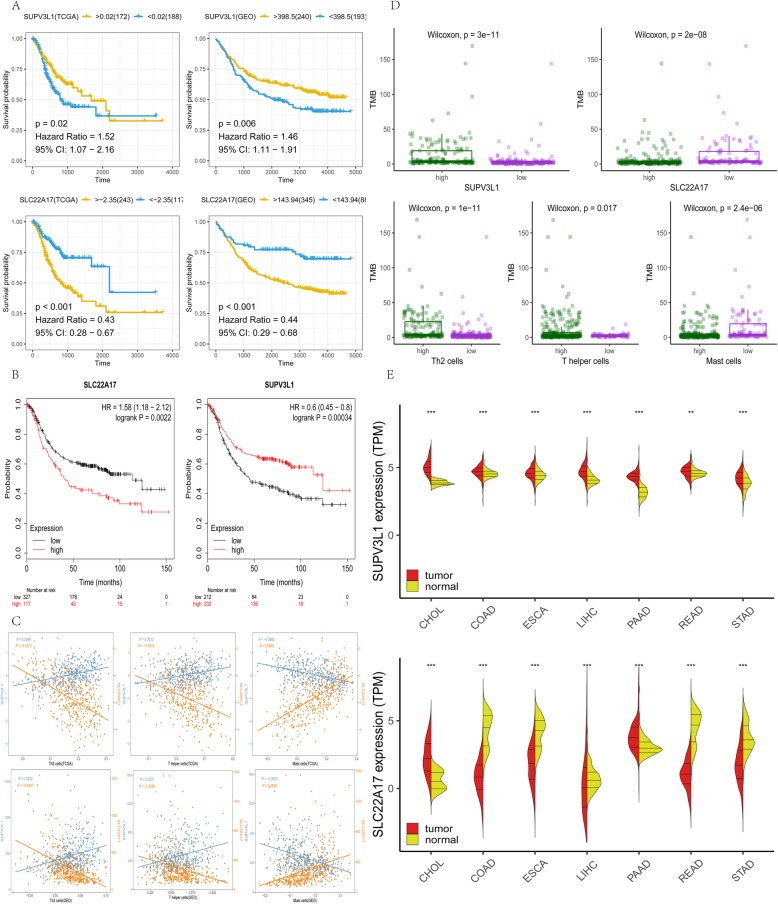
Fig. 2.
a Yellow lines represent a high expression of the gene, while blue lines represent a low expression of the gene. b Prognostic value of SUPV3L1 and SLC22A17 in gastric cancer patients were reconfirmed by Kaplan Meier-plotter .c Correlation between genes and immune cells. d Green represents high infiltration of immune cells, purple represents low infiltration of immune cells. e In cholangiocarcinoma (CHOL), Colon adenocarcinoma (COAD), Esophageal carcinoma (ESCA), Liver hepatocellular carcinoma (LIHC), Pancreatic adenocarcinoma (PAAD), Rectum adenocarcinoma (READ) and Stomach adenocarcinoma (STAD), expression of both genes shows significant differences in adjacent tissues and tumor tissues

