
Fig. 4.
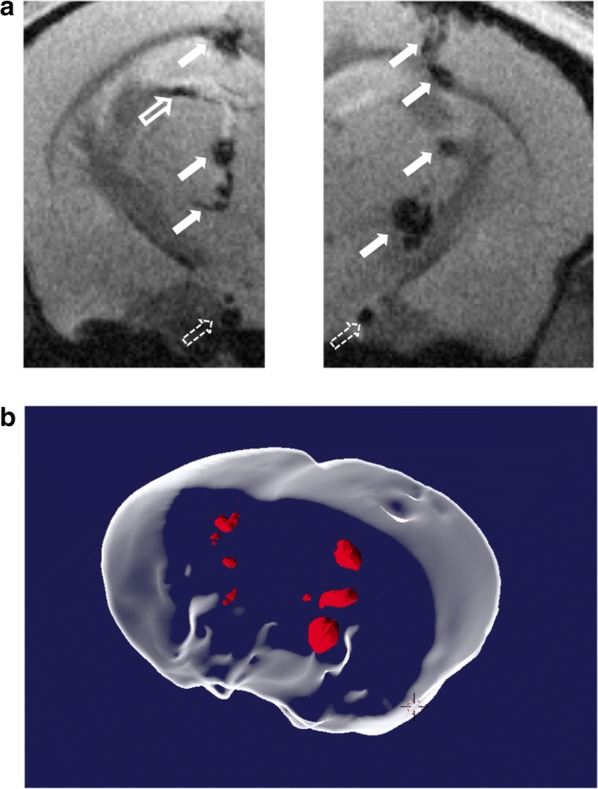
Detection of MDA-MB-231 cells labeled with BSA-NWs implanted in brains of living mice at 11.7 T. a Axial MR images of the brain of a mouse immediately after implantation of MDA-MB-231 cells labeled with BSA-NWs. Circa 10 cells were implanted on the left hemisphere (left image), while circa 100 cells were implanted in the right hemisphere (right image). NW labeled cells are distributed along the track opened by the needle used for their implantation (solid arrows), and partially infiltrated in the brain ventricle (hollow arrow). Large blood vessels (dashed arrows) appear as false positives for cell deposits (lack of specificity is a known limitation for in vivo imaging of T2 CAs). b Surface rendered reconstruction of the 3D set of T2* weighted images of the mice brain acquired after implantation of NW labeled cells. The signal produced by the labeled cells appears in red