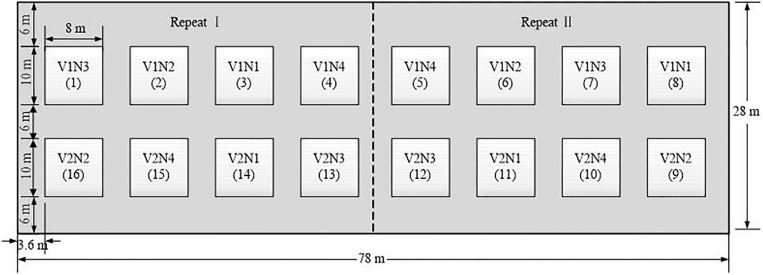
FIGURE 1.
Experimental design. (V1 and V2 represent Yangmai 16 and Yangmai 17 varieties, respectively. N1, N2, N3 and N4 represent different nitrogen treatments of 0, 225 kg⋅ha–1,450 kg⋅ha–1,900 kg⋅ha–1, respectively. Each level had two replicates. A total of 16 plots, the area of each experimental plot was 8*10 m2).

