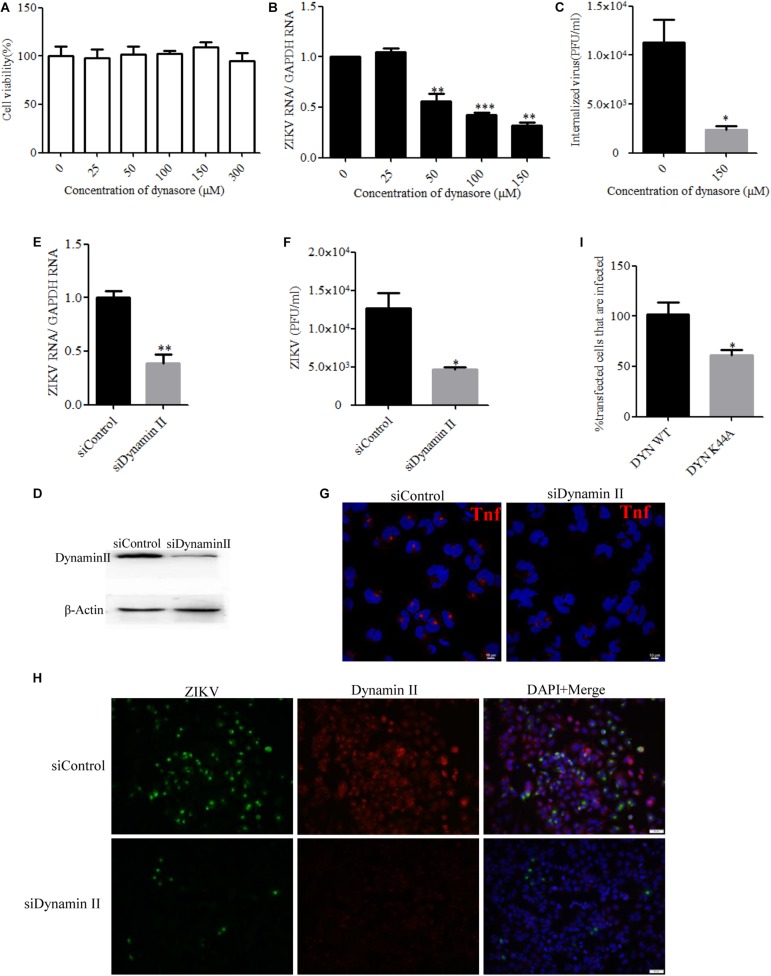
FIGURE 2.
Zika virus (ZIKV) entry depends on dynamin II. (A) Cell viability upon dynasore treatment was assessed by the MTT assay. (B,C) Treatment with dynasore inhibited the ZIKV entry into T98G cells. T98G cells treated with dynasore were incubated with ZIKV at a multiplicity of infection (MOI) of 10 for 1 h at 4°C and then shifted to 37°C for 1 h. The internalized viruses were determined by RT-qPCR (B) and infectious center assay (C). (D) To verify dynamin II knockdown, protein samples from the cells transfected with each siRNA were analyzed by immunoblotting for dynamin II. (E,F) T98G cells were transfected with siRNA targeting dynamin II or control siRNA for 48 h, followed by infection with ZIKV at an MOI of 10 for 1 h at 4°C and then shifted to 37°C for 1 h. The internalized viruses were determined by RT-qPCR (E) and infectious center assay (F). (G) T98G cells were transfected with siRNA targeting dynamin II or control siRNA for 48 h and then incubated with 10 μg/ml AF-555-labeled transferrin for 10 min at 37°C. The cells were fixed and stained with DAPI. Scale bars in all panels represent 10 μm. (H) T98G cells were transfected with siRNA targeting dynamin II or control siRNA for 48 h, followed by infection with ZIKV at an MOI of 0.5. At 48 h post-infection, the cells were fixed and analyzed under an Olympus microscope. Scale bars in all panels represent 50 μm. (I) The cells transfected with the dynamin II wild-type or dominant-negative plasmid construct were infected with ZIKV at an MOI of 0.5. At 48 h post-infection, the cells were analyzed by flow cytometry. One representative experiment out of three is shown (D). Representative confocal images from three independent experiments are shown (G,H). The data shown are the mean ± SD of three independent experiments (A–C,E,F,I). *P < 0.05; **P < 0.01; ***P < 0.001.

