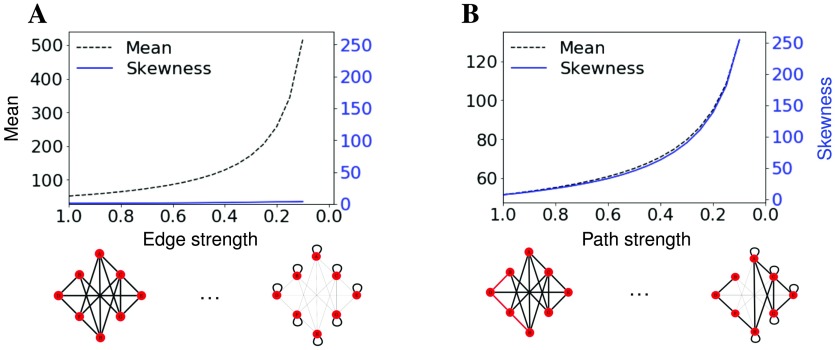
Figure 3. .
The skewness of the hitting-time distribution distinguishes a reduction of overall connectivity from a subgraph that becomes more linear. (A) Mean and skewness of hitting-time distribution as the strength of all connections is reduced by 0.05 for 19 iterations. Toy networks for this transition are represented on the x-axis. Reductions in connectivity are added as self loops. (B) Mean and skewness of hitting-time distribution as the strength of connections between linear component and the rest of the graph is reduced by 0.05 for 19 iterations. Toy networks on the x-axis represent synthetic graphs with a linear subgraph as the path (red) is made more linear.

