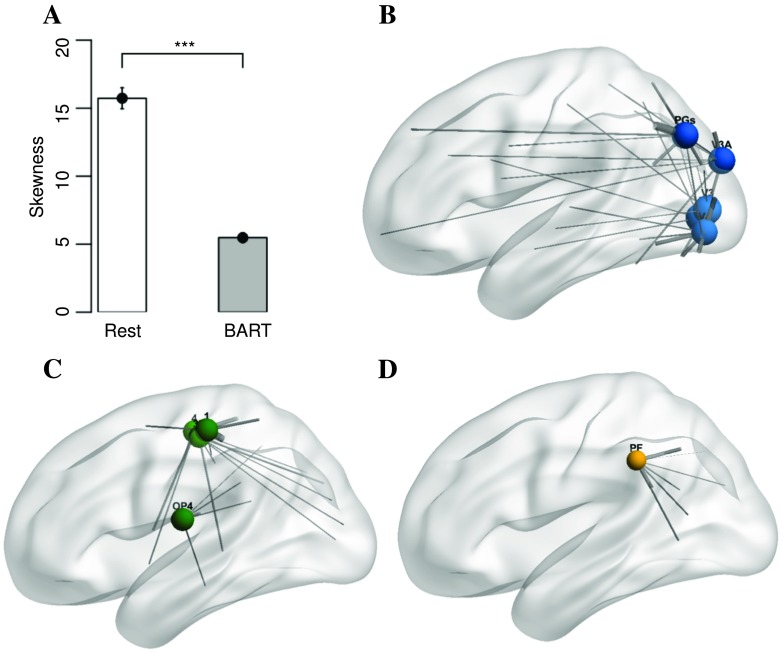
Figure 5. .
The distribution of skewness versus task for control subjects. p value significance codes: . = 0.1, * ≦ 0.05, ** ≦ 0.01, *** ≦ 0.001. The skewness of hitting-time distribution for control subjects is significantly smaller when the subjects are engaged in BART task compared with rest. The 10 nodes with largest hitting-time changes are (B) V2, V3, V4, V3A, and PGs (visual), (C) 1, 4, 3b, and OP4 (motor), and (D) PF. The size of each node represents the magnitude of difference of average to-hitting times (range from 19 to 30.2) and the thickness of each edge represents the magnitude of difference of partial correlation in BART compared with rest.

