Figure 6. .
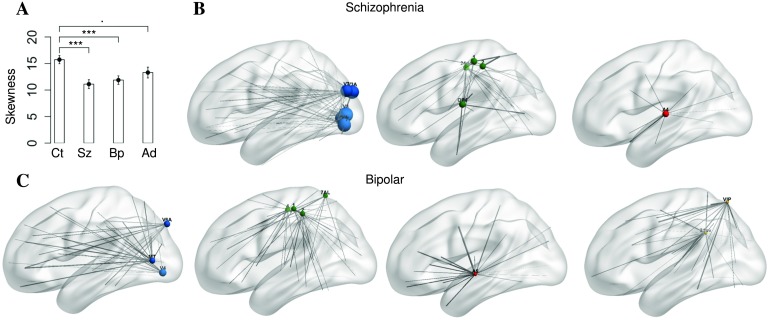
Skewness of the hitting-time distribution is significantly different across patient groups. (A) Distribution of skewness of the hitting-time distributions in patient and control groups during resting-state scans. Ct, Sz, Bp, and Ad stand for control, schizophrenia, bipolar, and ADHD, respectively. Significance codes: . = 0.1, * ≦ 0.05, ** ≦ 0.01, *** ≦ 0.001. The skewness of hitting-time distribution is significantly smaller for subjects with schizophrenia and bipolar disorders compared with neurotypicals. The 10 nodes with the largest change in hitting time for subjects with schizophrenia include V2, V3, V4, V3A, and V7 (visual, top blue), 1, 2, 24dd, and 4 (motor, top green), and A4 (auditory, top red). The 10 nodes with the largest change in hitting time for subjects with bipolar disorder include MT, V4, and V6A (visual, bottom blue), 1, 2, 4, and 7AL (motor, bottom green), A5 (auditory, bottom red), and VIP and 31pv (bottom yellow). The size of each node represents the magnitude of difference of average to-hitting times (range from 7.1 to 33.4) and the thickness of each edge represents the magnitude of difference of partial correlation in psychiatric disorder compared with control subjects during rest.

