Figure 3. .
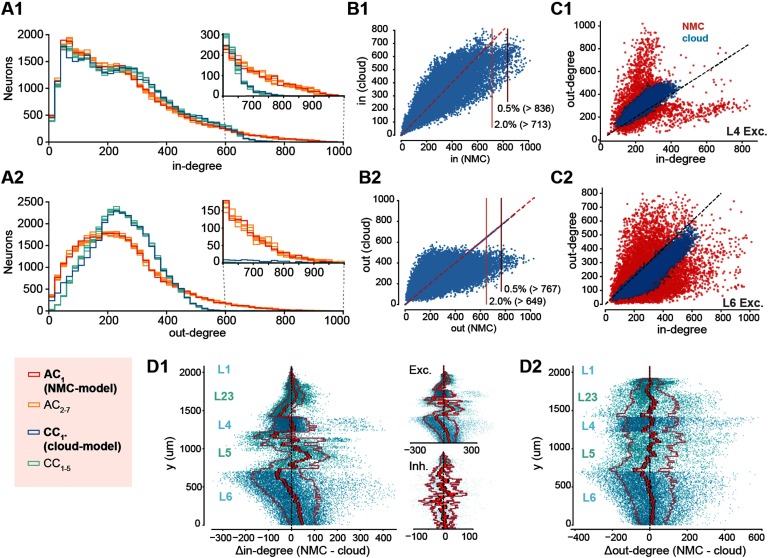
Decreased heterogeneity of degree distributions in cloud-model. (A1) In-degree distributions of neurons in NMC-model (AC1, red), in additional apposition-based connectomes (AC2–7, orange), the cloud-model (CC1*, blue), and the five cloud-connectomes (CC1–5, light blue). Insets show the same distributions starting from 600 for easier comparison. (A2) As A1, but for out-degree distributions. (B) Hub neurons in NMC- and cloud-models. (B1) Scatterplot of in-degree in NMC- versus cloud-model for the same neurons. Horizontal lines indicate 2.0% and 0.5% percentile in NMC-model. (B2) As B1 but for out-degree. (C1) In- versus out-degree scatterplot for NMC- and cloud-model for excitatory neurons in layer 4. (C2) In- versus out-degree scatterplot for NMC- and cloud-model for excitatory neurons in layer 6. (D1) Difference in in-degree of neurons between NMC- and cloud-model, across cortical depth. The bright red line indicates the mean across y-bins, the dark red line the standard error of the mean, and the outer, faded line the standard deviation. Insets: for excitatory and inhibitory subpopulations. (D2) As D1, but for out-degree.

