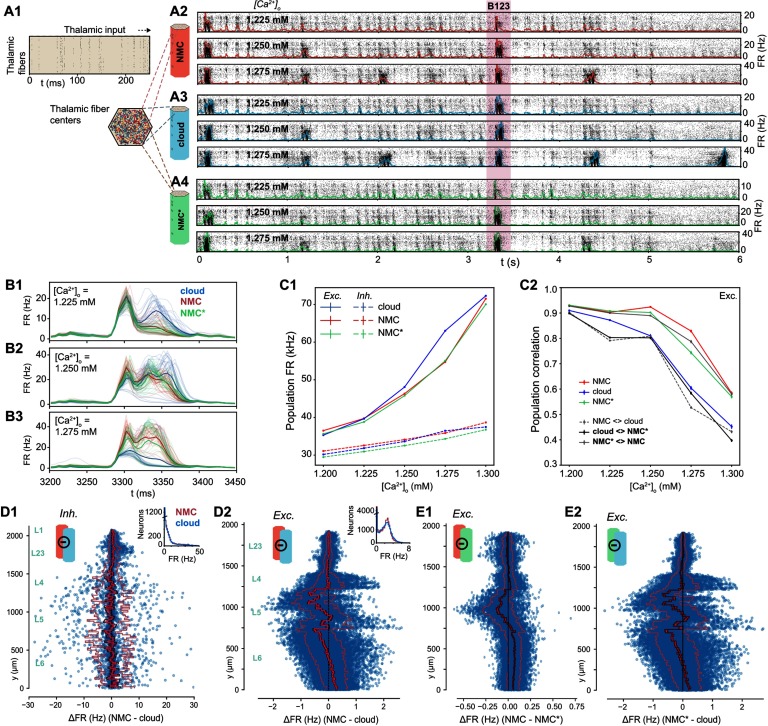
Figure 6. .
Simulating evoked activity in NMC- and cloud-models. (A1) Illustration of the first 250 ms of the thalamic input stimulating the microcircuit from t = 0 to 5 s. (A2) Evoked activity for all neurons in the NMC-model in response to input from A1 at three different [Ca2+]o-levels. (A3) Evoked activity for all neurons in the cloud-model at three different [Ca2+]o-levels. (A4) Evoked activity for all neurons in the NMC*-model at three different [Ca2+]o-levels. (B1) Time-dependent population firing rate for NMC-model (red), cloud-model (blue), and NMC*-model (green) for a 250-ms time period during the evoked activity (shaded red area in A234) at [Ca2+]o = 1.225 mM. Faint lines: population means for all 30 trials. Thick line: mean of all 30 trials. Bin size: Δt = 5 ms. (B2) As B1, but for [Ca2+]o = 1.25 mM. (B3) As B1 and B2, but for [Ca2+]o = 1.275 mM. (C1) Mean population firing rate of excitatory and inhibitory subpopulations during evoked activity at different [Ca2+]o-levels. Error bars indicate standard error of the mean over 30 trials. Note that error bars are smaller than linewidth. (C2) Average correlation coefficient between excitatory population PSTHs (Δt = 5 ms) for 30 trials. Mean of 30 × (30 − 1)/2 = 435 combinations for same model, and mean of 30 × (30 + 1)/2 = 465 combinations between models. (D1) Difference in firing rate of inhibitory neurons during evoked activity at [Ca2+]o = 1.25 mM. Blue dots indicate values for individual neurons, ordered along their soma positions with respect to the y-axis (cortical depth). Lines indicate mean (bright red), standard error (dark red), and standard deviation. Inset: Distribution of all mean firing rates. (D2) As D1, but for excitatory neurons. (E1) As D2, but for NMC-model and NMC*-model. (E2) As D1, but for NMC*-model and cloud-model.

