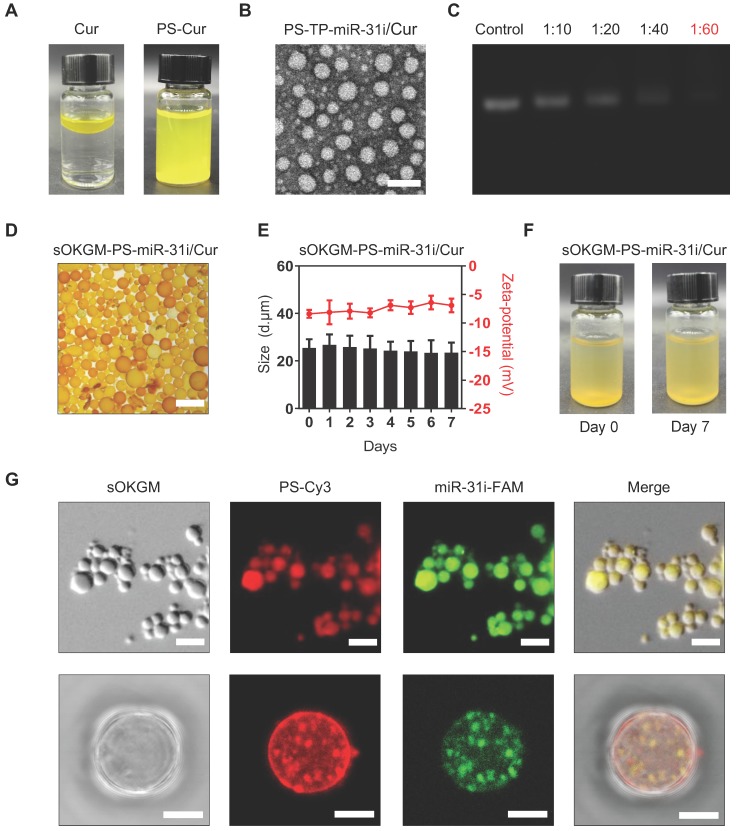
Figure 2.
Preparation and characterization of sOKGM-PS-miR-31i/Cur microspheres. (A) Images of the PS-miR-31i/Cur NPs (right) aqueous solution comparing to Cur in water solution (left). (B) TEM images of PS-TP-miR-31i/Cur NPs. Scale bars, 100 nm. (C) Efficiency of miR-31i loading to PS-TP-miR-31i/Cur NPs examined by agarose gel electrophoresis. Panel 1, miR-31i RNA (100 µg/mL); Panel 2 to 5, 1 hour after 100 µg/mL of miR-31i RNA incubating with PS-TP-Cur at concentrations of 1, 2, 4 and 6 mg/mL. The ratio represents miR-31i:PS-TP by weight. Bands: miR-31 inhibitor. (D) Images of sOKGM-PS-miR-31i/Cur microspheres. Scale bars, 50 µm. (E) The size distributions (left) and zeta potential (right) of sOKGM-PS-miR-31i/Cur microspheres over days. The results are reported as the mean ± standard deviation, n = 3. (F) Images of sOKGM-PS-miR-31i/Cur microspheres aqueous solution after 0 and 7 days of storage at 37°C. (G) Microscopy (upper panels) and high magnification confocal (bottom panels) images of sOKGM microspheres encapsulating PSs (labeled by Cy3, red) and miR-31i (labeled by FAM, green). Scale bar, 50 µm (upper panels) and 10 µm (bottom panels).

