Figure 3.
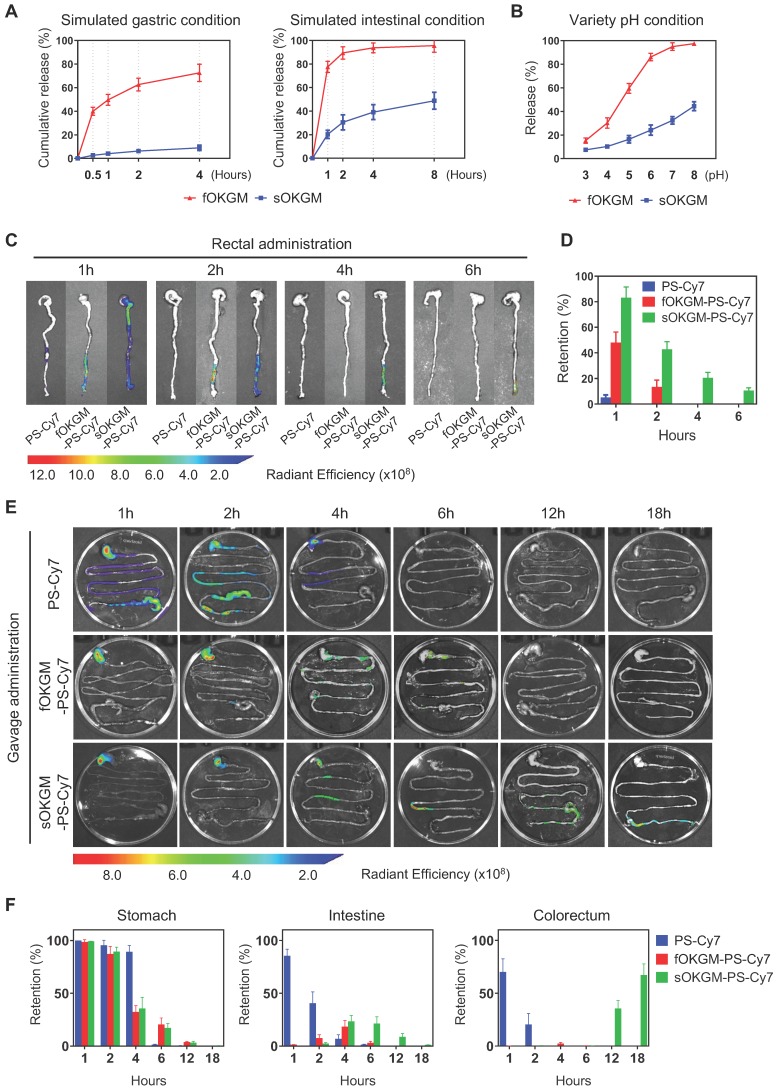
The controlled release and retention of sOKGM-PS microspheres in gastric and intestinal conditions. (A) Percentage of Cur release from sOKGM-PS-miR-31i/Cur and fOKGM-PS-miR-31i/Cur microspheres in simulated gastric and intestinal conditions over time. The results are reported as the mean ± standard deviation, n = 3. (B) Percentage of Cur release from sOKGM-PS-miR-31i/Cur and fOKGM-PS-miR-31i/Cur microspheres in water solutions with pH value at 4 hours. The results are reported as the mean ± standard deviation, n = 3. (C) The distribution of PS-Cy7 NPs, fOKGM-PS-Cy7 and sOKGM-PS-Cy7 microspheres after rectal administration over time, PS labeled by Cy-7. n = 3. (D) Quantification of the Cy7 signal coverage in stomach, intestine and colorectum in panel C. The results are reported as the mean ± standard deviation. (E) The distribution of PS-Cy7 NPs, fOKGM-PS-Cy7 and sOKGM-PS-Cy7 microspheres in gastrointestinal tract after gavage administration over time. PS labeled by Cy-7. n = 3. (F) Quantification of the Cy7 signal coverage in stomach, intestine and colorectum in panel E. The results are reported as the mean ± standard deviation, n = 3.

