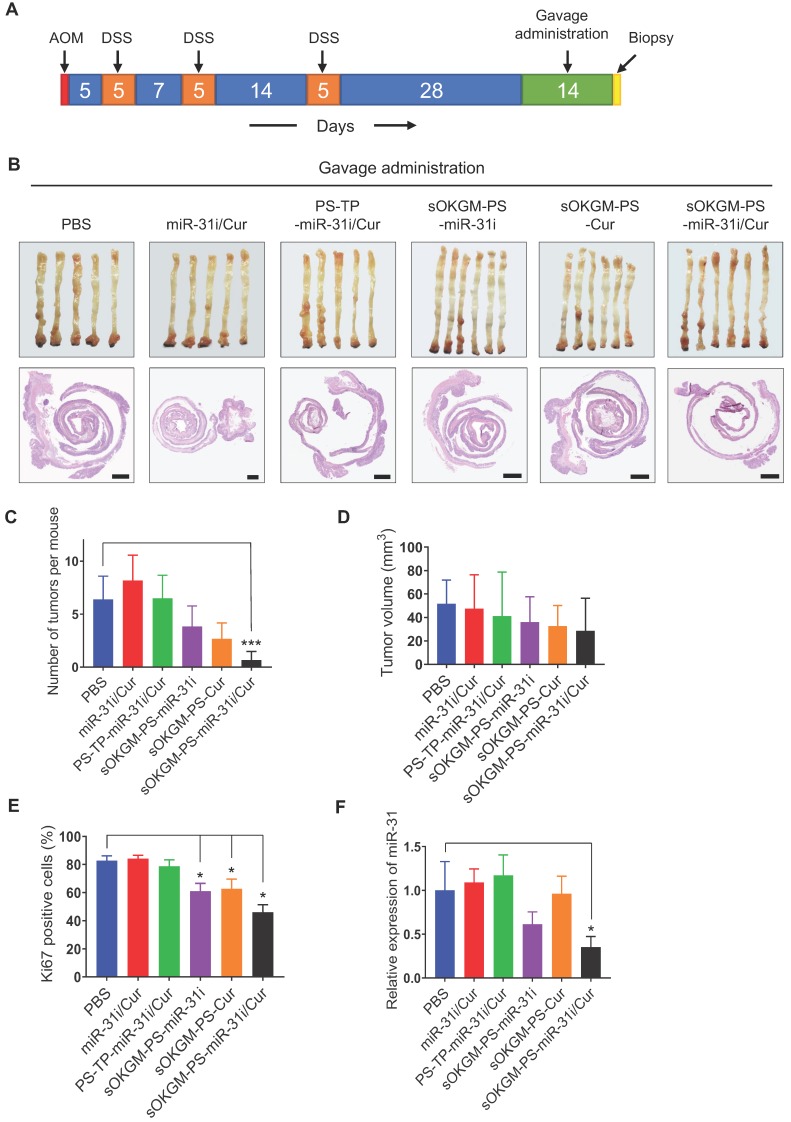
Figure 7.
Gavage delivery of sOKGM-PS-miR-31i/Cur microspheres suppressed colon tumor growth in vivo. (A) Schematics for gavage delivery of sOKGM-PS-miR-31i/Cur microspheres in treating AOM-DSS induced colon tumors. (B) Gross (upper) and Hematoxylin & eosin staining (bottom) images of colon tumors from mice gavage-treated with indicated formulations for 2 weeks. Scale bar, 1 mm. (C and D) Quantification of tumor numbers (C) and volume (D) shown in panel B. The results are reported as the mean ± standard deviation (PBS, n = 5; n = 6 for the other treatments), ***p < 0.001. (E) Quantification of the percentage of Ki67+ cells in tumors as shown in Figure S7B. The results are reported as the mean ± standard deviation (PBS, n = 5; n = 6 for the other treatments), *p < 0.05. (F) qRT-PCR analysis for miR-31 in colon tumors from mice gavage-treated with indicated formulations for 2 weeks. The results are reported as the mean ± standard deviation (PBS, n = 5; n = 6 for the other treatments), *p < 0.05.

