Figure 1.
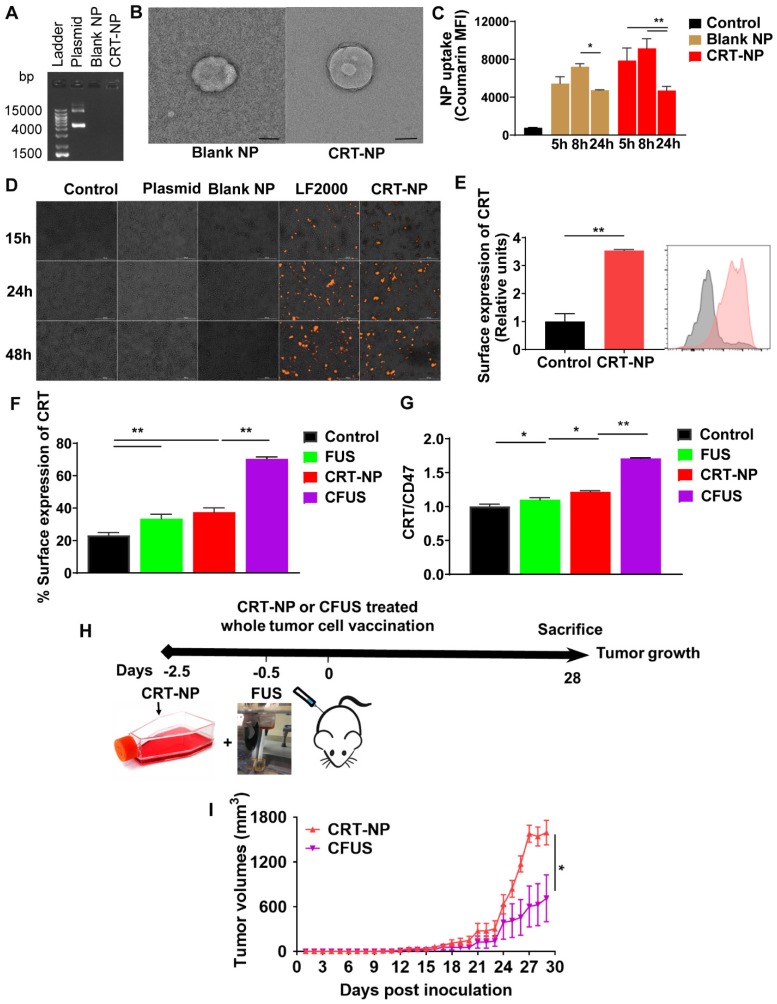
Combination of FUS with CRT-NPs therapy increased the CRT expression and CRT/CD47 ratio. (A) Characterization of CRT-NP using gel retardation assay suggested complete encapsulation of CRT plasmid in the NPs. In contrast, blank NPs and CRT-NPs demonstrated no band. (B) Transmission electron microscopy of CRT-NP demonstrated a typical core-shell morphology with the encapsulated plasmid compared to blank NP Scale bar is 100 nm. (C) Quantification of coumarin labeled CRT-NP uptake using flow cytometry showed efficient uptake from 5-8h similar to blank NPs. The median fluorescence intensity (MFI) of coumarin reduced at 24h likely due to NP lysis over time. (D) Fluorescence imaging of B16F10 cells incubated with CRT-NPs (2 µg DNA) showed efficient transfection and protein expression (orange) similar to LipofectamineTM2000 (LF2000). (E) Flow cytometric analysis of surface expression of CRT 48 h after CRT-NP transfection (4 µg DNA) is shown in bar graph and histogram plot (n=3). Control (grey peak) indicates non-transfected cells. (F and G) Flow cytometric analysis of surface CRT expression (F) and CRT to CD47 ratio (G) in B16F10 cells transfected with CRT-NP (1 µg DNA) for 40-42h followed by FUS treatment (n=3). CRT-NP + FUS (CFUS) resulted in the highest CRT expression and CRT to CD47 ratio. (H-I) CFUS enhanced tumor regression compared to CRT-NPs. Mice vaccinated s.c. in the flank with 4x10⁶ B16F10 cells transfected with CRT-NPs ± FUS (n=5) showed relatively slower tumor growth in CFUS cohorts than CRT-NP. Data are shown as mean ± SEM. Statistics were determined by ANOVA followed by Fisher's LSD without multiple comparisons correction. Differences between control and CRT-NP were analyzed using an unpaired t test. * p < 0.05, ** p < 0.01.

