Figure 3.
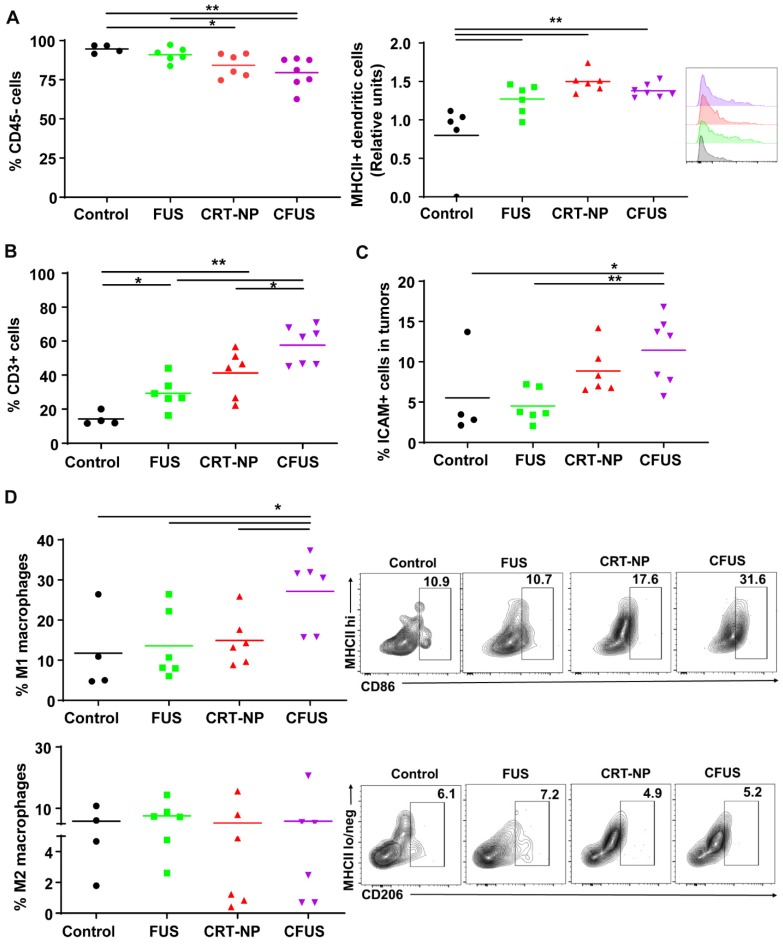
Local CRT-NP and FUS therapy activated antigen presenting cells and induced infiltration of T-cells in the tumor. (A) Percentage of CD45 minus (-) cells (tumor cells and fibroblasts) was decreased with CFUS and CRT-NP therapy compared to untreated control. Infiltration of dendritic cells expressing activation marker namely MHCII was enhanced by monotherapies and CFUS. Histograms plots showed an increase in median fluorescence intensity (MFI) of MHCII expressed on intratumoral dendritic cells for the treatments compared to control. (B) Population of CD3+ cells increased by 2-3-fold for FUS, CRT-NP and CFUS compared to control. (C) CFUS tumors showed ~2-fold higher ICAM-1 expression than control. (D) Percentage of macrophages (CD11b+ F4/80+) in the tumors were analyzed to determine M1 and M2 subtypes. MHCIIhi CD86+ for M1 showed significant increase with CFUS and MHCIIlo/neg CD206+ was unaltered for the M2 subtypes in treated tumors. Data are shown as mean ± SEM, one-way ANOVA followed by Fisher's LSD without multiple comparisons correction. Differences between control and treatments in C were analyzed using an unpaired t test assuming unequal variance. * p < 0.05, ** p < 0.01.

