Figure 7.
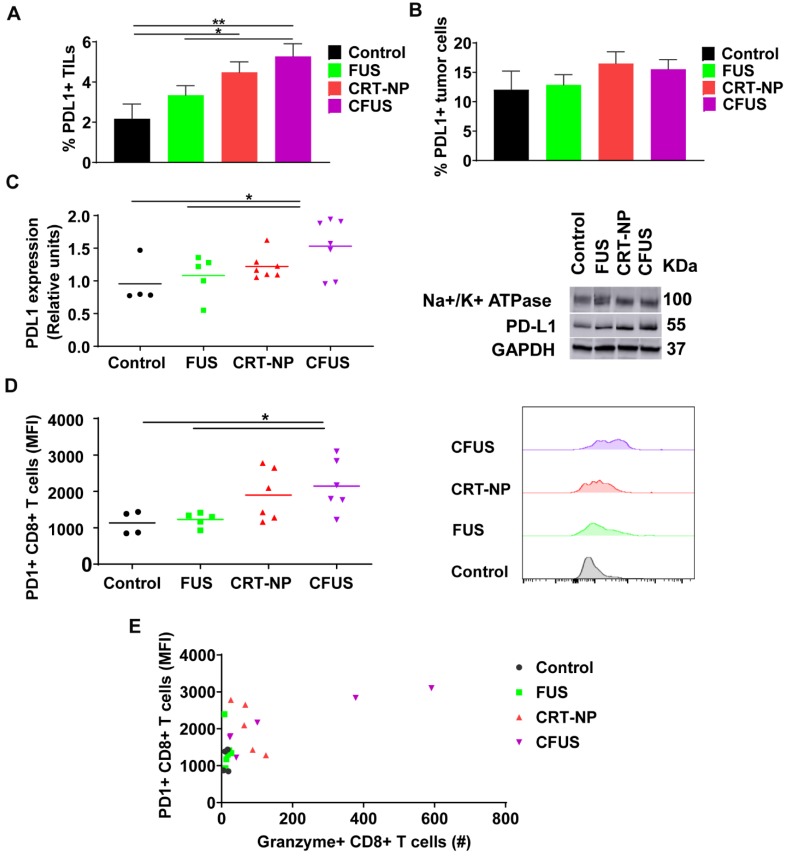
CRT-based ICD therapy modulated the checkpoint markers in tumors and T cells. The surface expression of PD-L1 and PD-1 in treated tumors was analyzed using flow cytometry and western blot and shown as mean ± SEM. (A) Percentage of PD-L1+ TILs were significantly enhanced by CFUS and CRT-NP (n=3-4). (B) Frequency of PD-L1+ tumor cells did not change with treatments. (C) Representative western blots of PD-L1 from crude membrane fractions of tumors. Na+/K+ ATPase was used as a loading control (n=4-7). (D) PD-1 expression on CD3+ CD8+ T cells represented as median fluorescence intensity (MFI). Histogram plots indicate the difference in PD-1 MFI among groups. (E) The relationship between the PD-1+ CD8+ T cells and Granzyme B+ CD8+ T cells showed correlation in responding mice. Pearson's r = 0.644, p < 0.01. Statistics were determined by ANOVA followed by Fisher's LSD without multiple comparisons correction. * p < 0.05, ** p < 0.01.

