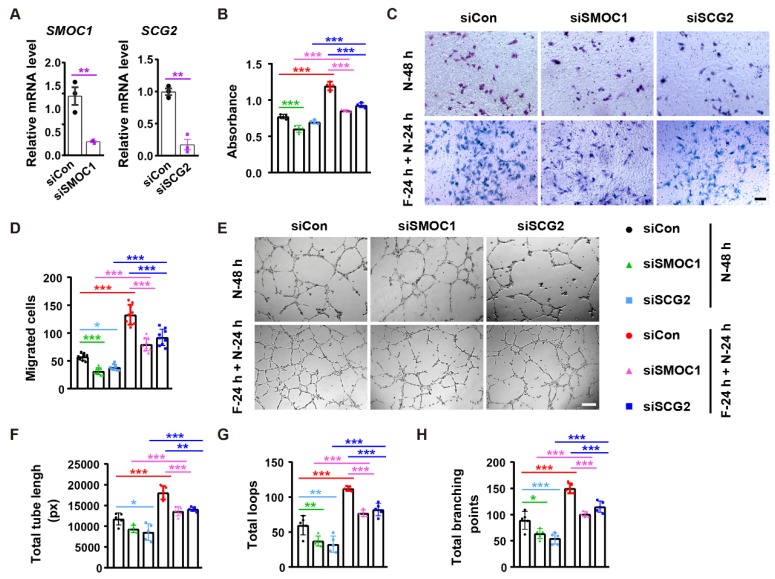
Figure 7.
SMOC1 and SCG2 partially mediate the fasting/refeeding-induced promotion of angiogenesis. (A) qRT-PCR analysis of the expression of SMOC1 and SCG2. n = 3 per group. (B) Endothelial cell proliferation was assessed by CCK-8 analysis. n = 4 per group. (C and D) Representative images of transwell migration assay (C) and the migrated cell numbers (D). Scale bar: 100 μm. n = 3 per group. (E-H) Representative tube formation images (E) and quantification of total tube length (F), loops (G) and branching points (H). Scale bar: 250 μm. n = 5 per group. For (A): Unpaired, two tailed student's t-test. For (B, D, F, G and H): One-way ANOVA combined with Bonferroni post hoc test. *P < 0.05, **P < 0.01, ***P < 0.001.

