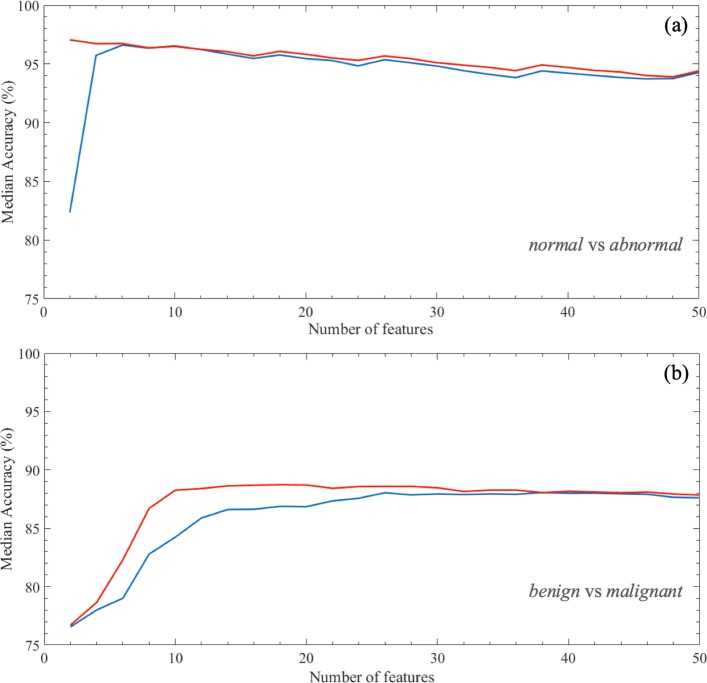
Fig. 6.
Median accuracy (%) with the growth of the number of features. The median value is calculated on 100 rounds of 10-fold cross validation for increasing values of the number of features used to train the proposed model to classify ROIs into a normal/abnormal b and benign/malignant. Two different feature selection approaches are used, that are embedded (red line) and filter (blue line) methods

