. 2019 Oct 18;10(44):10231–10239. doi: 10.1039/c9sc03524a

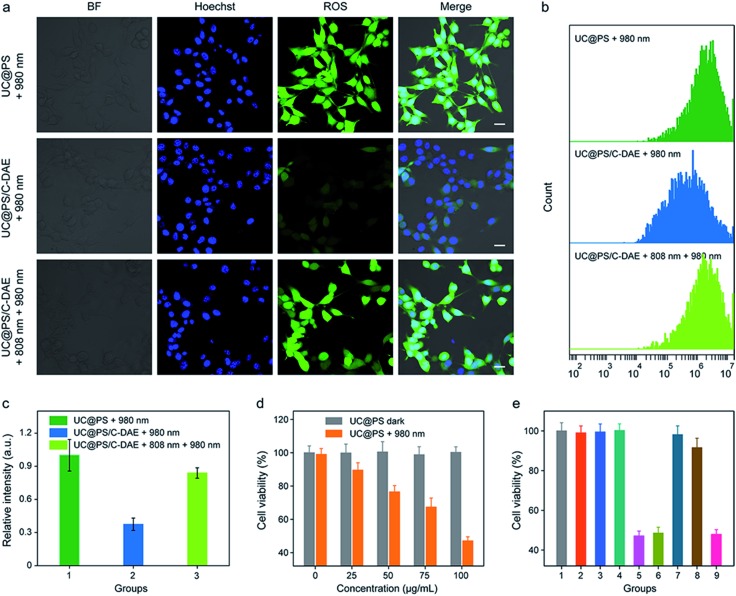
Fig. 4. (a) CLSM images of 4T1 cells after different treatments. DCF-DA was used as an indicator of 1O2 in cells. Nuclei stained with Hoechst 33342. For DCF-DA images, λex = 488 nm, λem = 535–585 nm. Scale bar: 20 μm. (b) Flow cytometry showing the fluorescence of 4T1 cells with different treatments. (c) Quantification of the flow cytometric data in (b). Data are represented as means ± SD (N = 3). (d) Cytotoxicity assay of 4T1 cells incubated with different concentrations of UC@PS without or with 980 nm irradiation. (e) Cytotoxicity assay of the cells with different treatments. (1) Saline, (2) 980 nm, (3) 808 nm + 980 nm, (4) UC@PS, (5) UC@PS + 980 nm, (6) UC@PS + 808 nm + 980 nm, (7) UC@PS/C-DAE, (8) UC@PS@C-DAE + 980 nm, and (9) UC@PS/C-DAE + 808 nm + 980 nm. Data are represented as means ± SD (N = 4). For the irradiation, 808 nm (0.5 W cm–2, 3 min) and 980 nm (1.2 W cm–2, 20 min, 5 min break after 1.5 min irradiation) were applied.

Fig. 4