
Figure 3. Detection of Nonenzymatic DPCs by the ARK Assay.
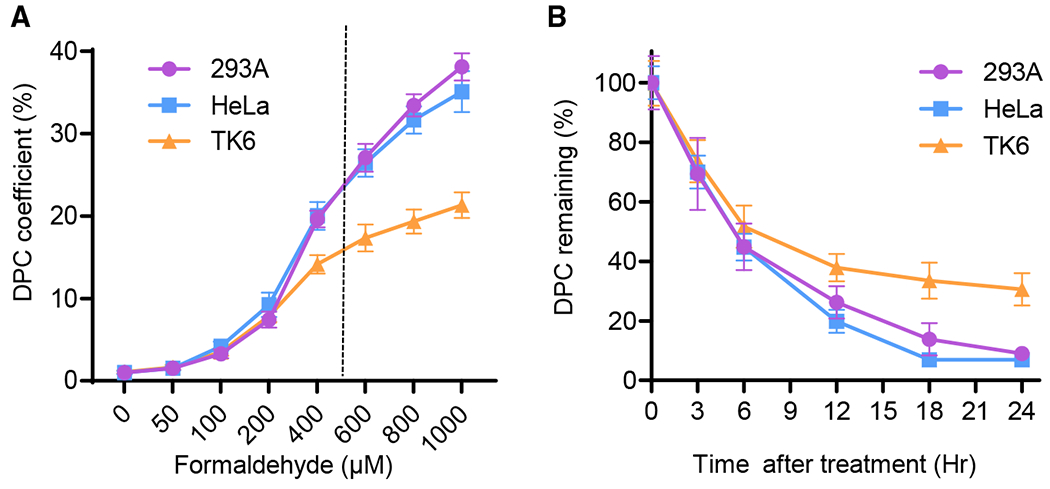
(A) Dose response of 293A, HeLa, and TK6 cells exposed to the indicated concentrations of FA for 2 h. DPC fold inductions were calculated by normalizing DPC-associated DNA to that of mock treatment.
(B) DPC repair time course in 293A, HeLa, and TK6 cells exposed to 400 μM FA treatment for 2 h. DPC coefficient of each cell line after treatment is set as 100%.
n = 4 for (A) and n = 6 for (B). The error bars depict standard deviations.