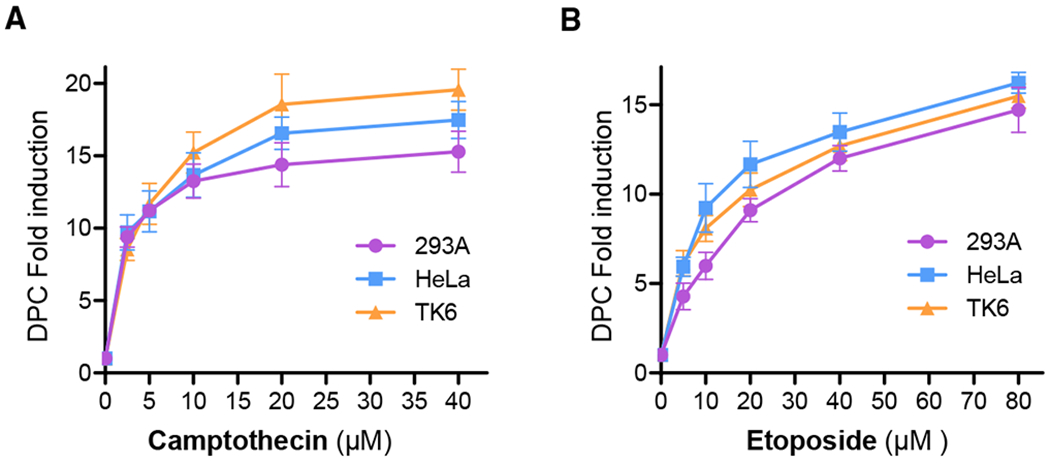
Figure 4. Detection of Enzymatic DPCs Induced by Topoisomerase Inhibitors with the ARK Assay.

(A) 293A, HeLa, and TK6 cells were exposed to various doses of CPT for 1 h and analyzed by the ARK assay to generate DPC fold induction by normalizing the DPC coefficient of each sample against that of the mock-treated control.
(B) HeLa, 293A, and TK6 cells were exposed to various doses of etoposide for 1 h and analyzed by the ARK assay to generate the DPC fold induction by normalizing the DPC coefficient of each sample against that of the mock-treated control.
Each data point was generated from no less than 5 biological repeats with triplication. The error bars depict standard deviations.
