
Figure 5. Analysis of DPC Repair Deficiency in SPRTN and TDP1/TDP2 Knockout Mutants with the ARK Assay.
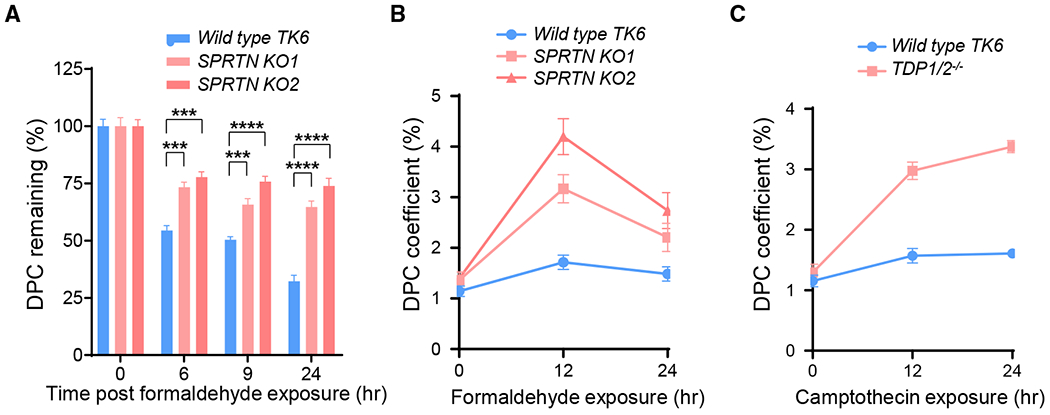
(A) Removal of DPCs in wild-type TK6 cells and 2 SPRTN knockout derivatives (KO1 and KO2). Cells were exposed to 400 μM FA for 2 h. DPC coefficients were determined for each cell line at the indicated time points and normalized against the 0 time point to arrive at the percentages of DPCs remaining.
(B) DPC accumulation in wild-type TK6 cells and 2 SPRTN knockout derivatives continuously exposed to low-dose FA (50 μM) for 12 and 24 h.
(C) DPC accumulation in wild-type TK6 cells and a TDP1/2−/− double-knockout derivative continuously exposed to CPT (75 nM) for 12 and 24 h.
Each data point in the plots and in the bar graphs was derived from no less than 5 biological repeats with duplicates or triplicates. One-way ANOVA analyses for the three time points 6, 9, and 24 h generated p < 0.0001 in (A) for the F-test and interested pairwise Tukey test results are indicated. Number of biological repeats with triplication = 3. The error bars depict standard deviations.