Fig. 1.
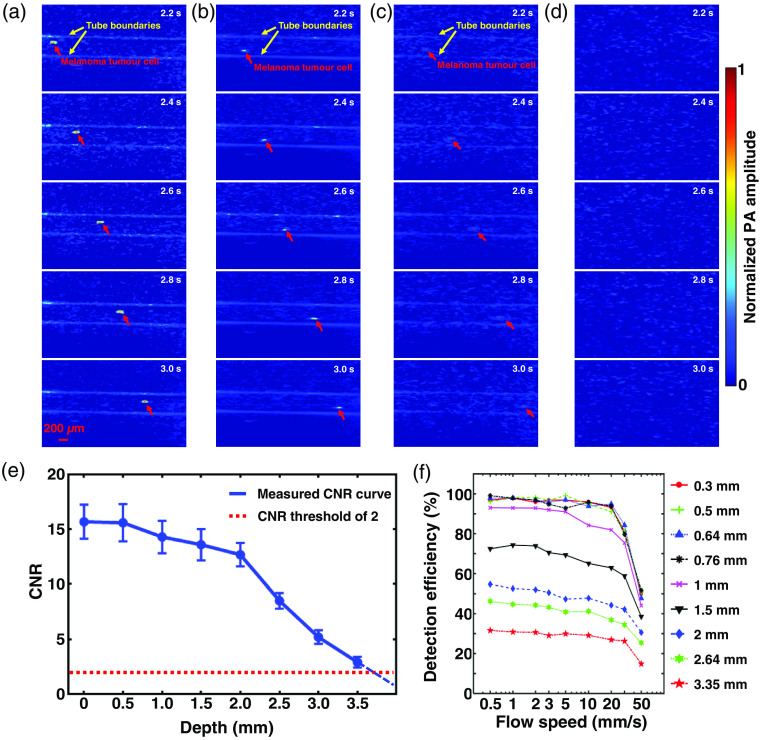
LA-PAT of single melanoma tumor cells in phantom. (a) Photoacoustic snapshots of a single melanoma tumor cell in a transparent phantom with a CNR of 16.4. The yellow arrows show the microtube boundaries. The red arrows highlight the circulating single melanoma tumor cell [Video 1(a)]. (b) Photoacoustic snapshots of a single melanoma tumor cell 1.5 mm deep in a scattering phantom with a CNR of 14.2 [Video 1(b)]. (c) Photoacoustic snapshots of a single melanoma tumor cell 3 mm deep in a scattering phantom with a CNR of 4.3 [Video 1(c)]. (d) Photoacoustic snapshots of the scattering phantom at a depth of 4 mm. No melanoma tumor cells are visible. (e) CNRs of the melanoma tumor cells in photoacoustic images degrade with increasing imaging depth. With a CNR threshold of 2, the maximum depth at which a melanoma tumor cell could be detected was . (f) The melanoma tumor cell detection efficiency of LA-PAT decreases with increasing blood flow speed and vessel diameter.

