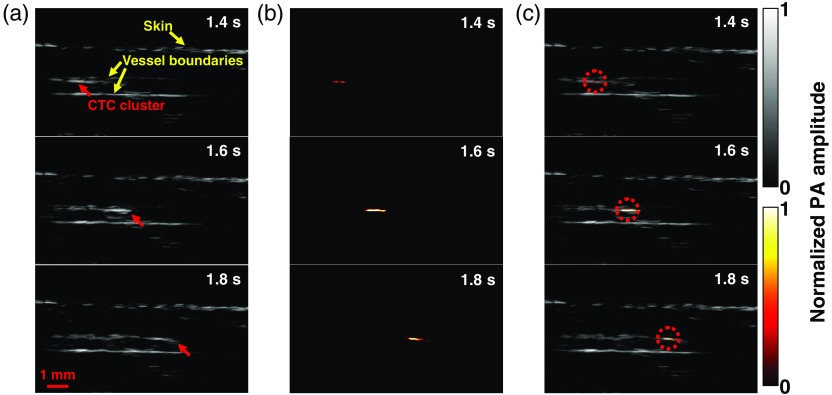
Fig. 7.
LA-PAT of a suspected melanoma CTC cluster in patient 3. (a) Photoacoustic snapshots of the melanoma CTC cluster in the patient. The yellow arrows indicate structures, including the skin and vessel boundaries. The red arrows highlight the melanoma CTC cluster. (b) Differential photoacoustic images showing only the melanoma CTC cluster. (c) Differential photoacoustic images (b) superimposed on structural photoacoustic images (a), highlighting the melanoma CTC cluster [Video 2(d)].

