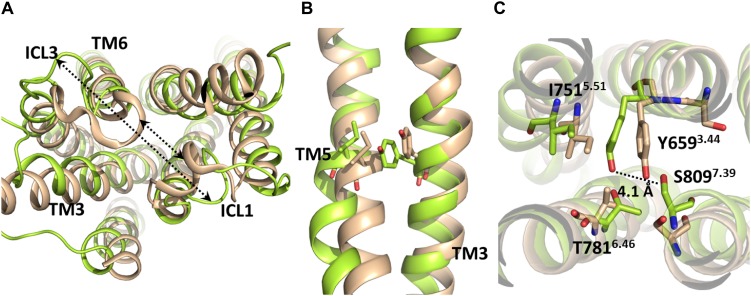
FIGURE 4.
Molecular superposition between the inactive crystallographic (brown) and active-like (from-umbrella-sampling/MD, green) TM domains of mGlu5. (A) The arrows indicate the separation between ICL1-TM6/ICL3 after umbrella sampling simulation. (B) Lateral view of inactive and post-PMF/MD TM domains of mGlu5. Note the outward movement undergone by TM5 to reach an active-like conformation. (C) Bottom view of the inactive and post-PMF/MD TM domains of mGlu5. The dotted line shows the separation between Tyr6593.44 and Ser8097.39.

