Figure 1.

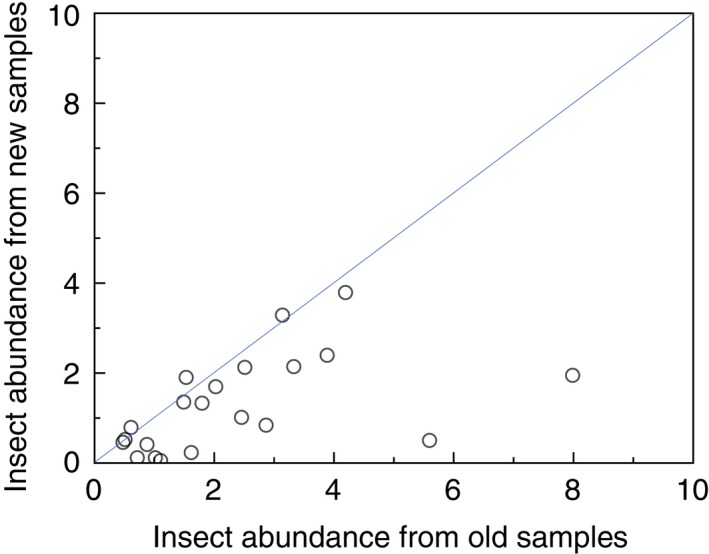
Mean insect abundance in recent samples in relation to mean insect abundance in old and recent samples of insects from the same locations. See the main text for definitions of abundance. The blue line is Y = X. Data are located in Table S1

Mean insect abundance in recent samples in relation to mean insect abundance in old and recent samples of insects from the same locations. See the main text for definitions of abundance. The blue line is Y = X. Data are located in Table S1