Figure 5.
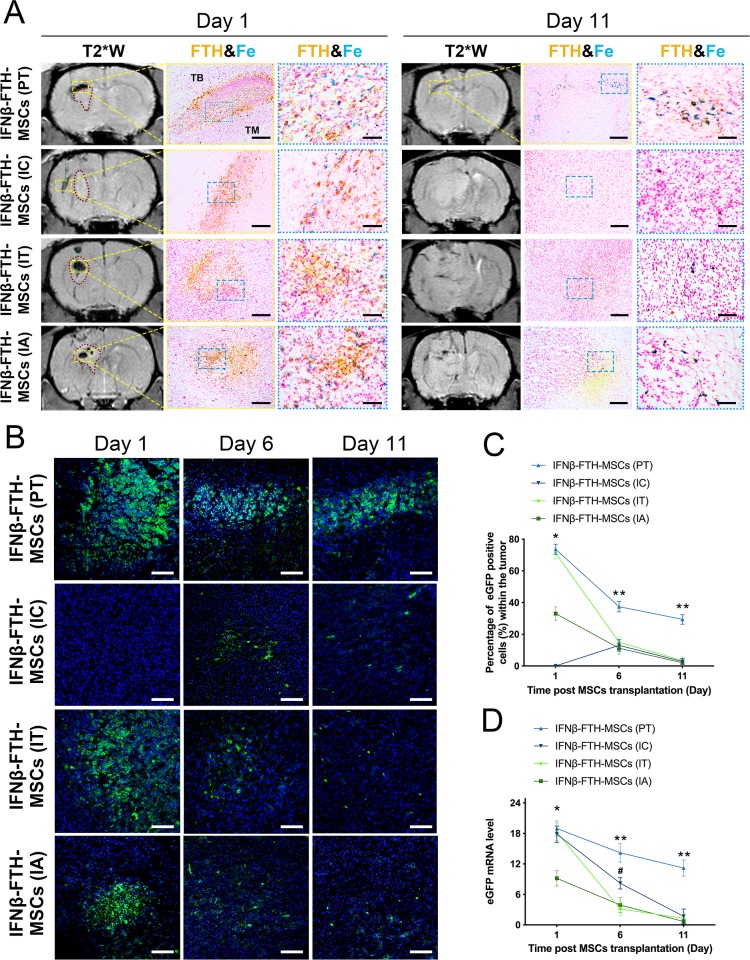
Homing, engraftment, distribution and survival of IFNβ-FTH-MSCs. (A) Representative micrographs of immunohistochemistry for FTH and Prussian blue staining (Fe) show, on day 1 (the day of injection), the homing and engraftment of IFNβ-FTH-MSCs via different administration routes as detected by histology were well matched with the findings on the T2*W images. On day 11, only IFNβ-FTH-MSCs in peritumoral injection (PT) group were detectable on MRI, while IFNβ-FTH-MSCs in the other three groups were not detected on MRI due to the very small quantity of surviving cells. Gliomas appeared as a mass with a slightly hyperintense signal on T2*W images (red dotted lines). Needle trajectories of MSCs transplantation were marked as green dotted lines. TB: tumor border. TM: tumor mass. Bar=200 µm (middle panels) and 50 µm (right panels). (B) Representative micrographs of immunofluorescence of eGFP shows that, in PT group, massive eGFP+ cells (green) were found at the tumor border on day 1, then a considerable number of eGFP+ cells remained by day 11. In intratumoral injection (IT) and intra-internal carotid arterial injection (IA) groups, numerous eGFP+ were found within the tumor on day 1, a majority of eGFP+ cells disappeared on day 6, and few eGFP+ cells could be seen in the tumor by day 11. In intracerebral injection (IC) group, no eGFP+ cells were seen in the tumor on day 1, a few eGFP+ cells were found within the tumor on day 6, whereas very few eGFP+ cells on day 11. Bar=50 µm. Graphs show except for PT group, the percentage of eGFP+ cells (C) and eGFP mRNA level (D) in IC, IT and IA groups all diminished to almost complete disappearance on day 11. n=3. *p<0.001 between PT, IC and IT, IA; **p<0.001 between PT and IC, IT, IA; #p<0.05 between IC and IT, IA.

