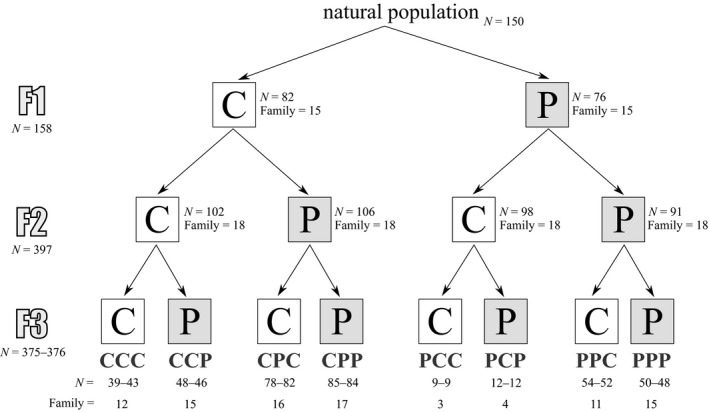
Figure 2.

Number of individuals (N) and families (Family) at each generation (F1, F2, and F3). "C" stands for control environment and "P" for predator‐cue environment. For the F3 generation, two number of individuals are reported, one for behavioral measurements (first position) and one for other measurements (second position)
