Figure 3.

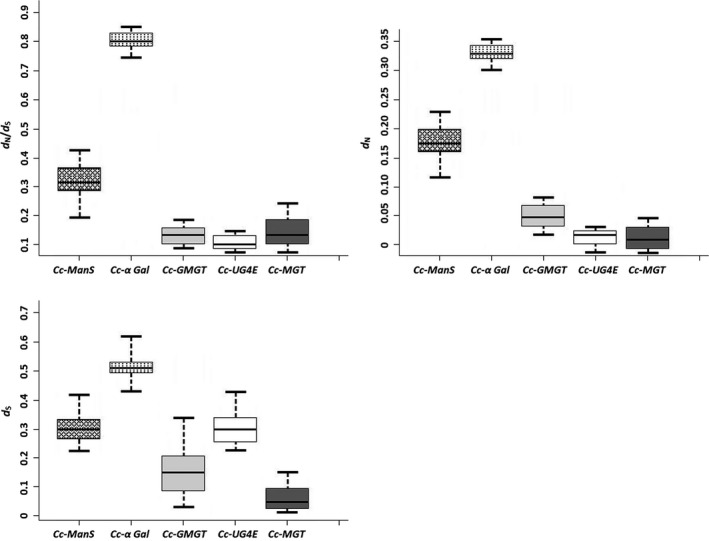
Evolutionary rates at silent and replacement sites of the GM pathway genes. Average values of d S, d N, and d N/d S are represented by horizontal bars within the boxes at 95% confidence intervals

Evolutionary rates at silent and replacement sites of the GM pathway genes. Average values of d S, d N, and d N/d S are represented by horizontal bars within the boxes at 95% confidence intervals