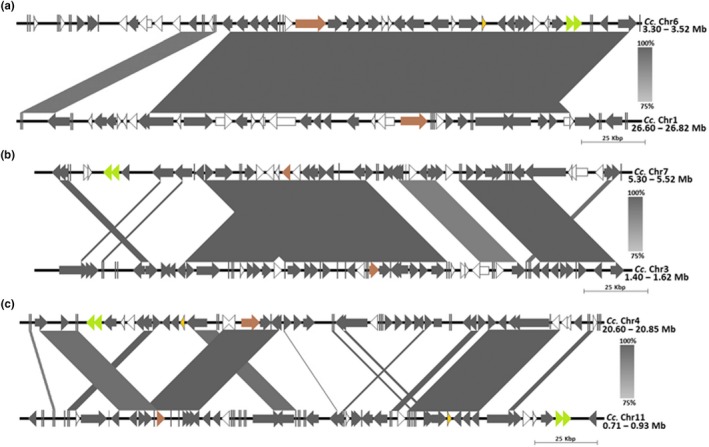
Figure 4.

Synteny analysis of tandem chromosomal regions for Man‐S (a), Cc‐GMGT (b), showing extensive alignments, and in Cc‐alpha Gal (c), with less conserved (<60%) syntenic alignment of the two chromosome segments. Arrow heads represent different segment features, and target gene position is shown in dark brown color. Color intensity of gray diagonal blocks represents rate of conserved sequence sites on chromosomes
