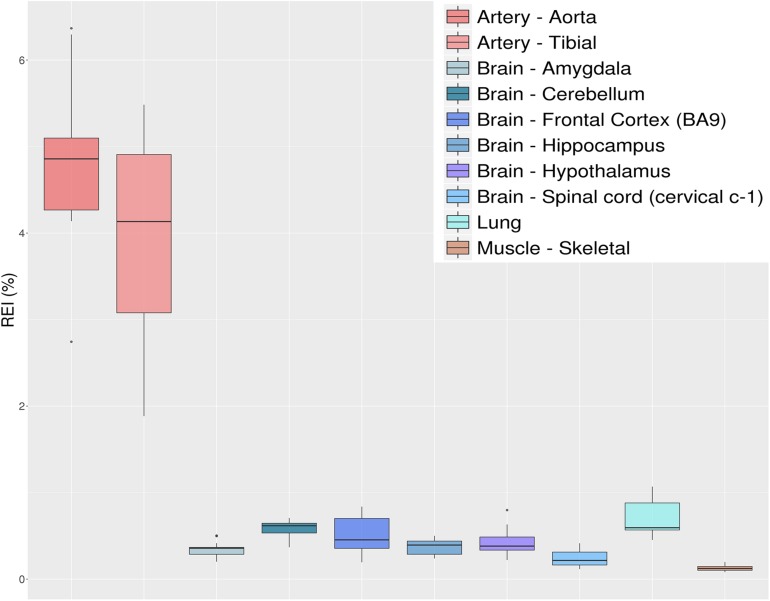
FIGURE 8.
Distributions of recoding editing index (REI) values over 10 selected tissues from the GTEx project reported as box-plots. REI is calculated as the weighted average of editing levels over all known recoding sites from the REDIportal database. Most brain sub-tissues show similar levels of recoding editing. A remarkable exception is represented by the aorta and tibial artery showing a surprisingly high editing level.

