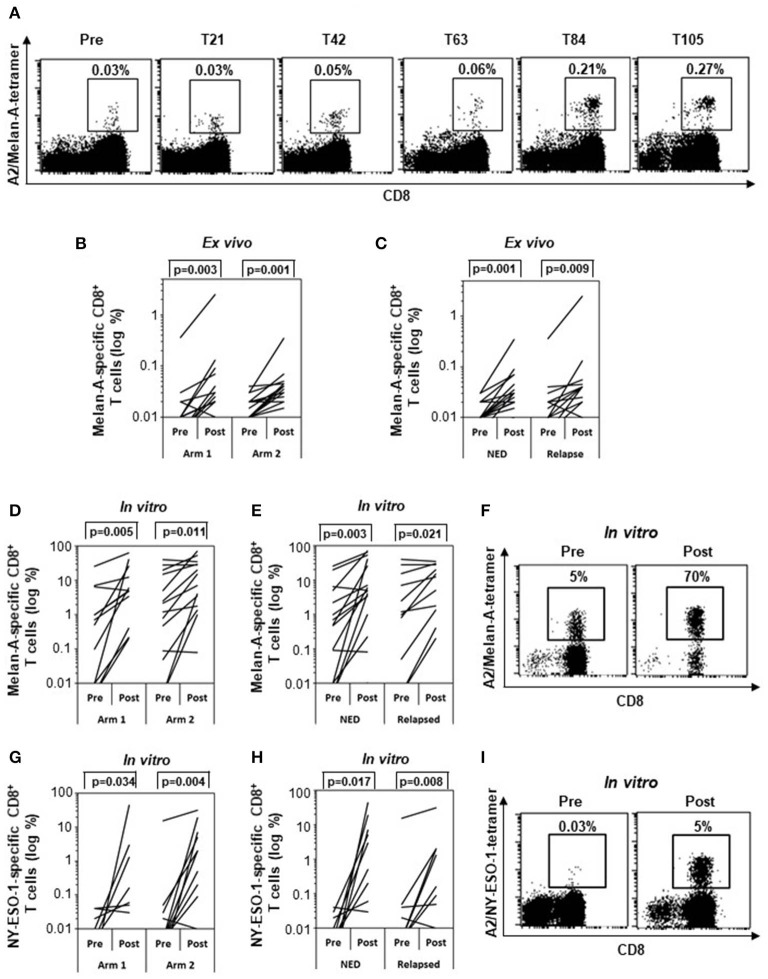
Figure 3.
Specific immune response. Frequencies of Melan-A– (A–F) and NY-ESO-1–specific (G–I) CD8+ T cells analyzed by tetramer staining (n = 29). (A) Kinetic analysis of the frequency of Melan-A–specific T cells between pretreatment and posttreatment samples (T21, T42, T63, T84, T105) in one representative patient (patient 29). (B,C) Variation of Melan-A–specific T cell percentage between pretreatment and posttreatment ex vivo samples in arm 1 (n = 15) vs. arm 2 patients (n = 14) (B) and in patients with no evidence of disease (NED) (n = 16) vs. relapsed patients (n = 13) (C). (D,E,G,H) Variation of Melan-A– (n = 28) (D,E) and NY-ESO-1–specific (n = 26) (G,H) T cell percentage after short term in vitro expansion, in arm 1 vs. arm 2 patients (D,G) and in patients with no evidence of disease (NED) vs. relapsed patients (E,H). (F,I). Representative staining (patient 09) of short term in vitro expansion before (pre) and after (post, T105) stimulation with Melan-A (F) and NY-ESO-1 (I) peptides. p values were calculated by Wilcoxon signed-rank test.

